Forum
Forum OPRR
OPRR Finance
 Specials
 On-chain Eco
 Entry
Entry
 Podcasts
 Data
Data

Bitcoin Hits $110,000 All-Time High: Is It a Replay of the Double Top Trap or the Beginning of a New Cycle?

 Summarized by AI
Original Article Title: "Bitcoin Once Again Reaches an All-Time High, Will the Bull Market Cycle Repeat?"
Original Article Author: ChandlerZ, Foresight News
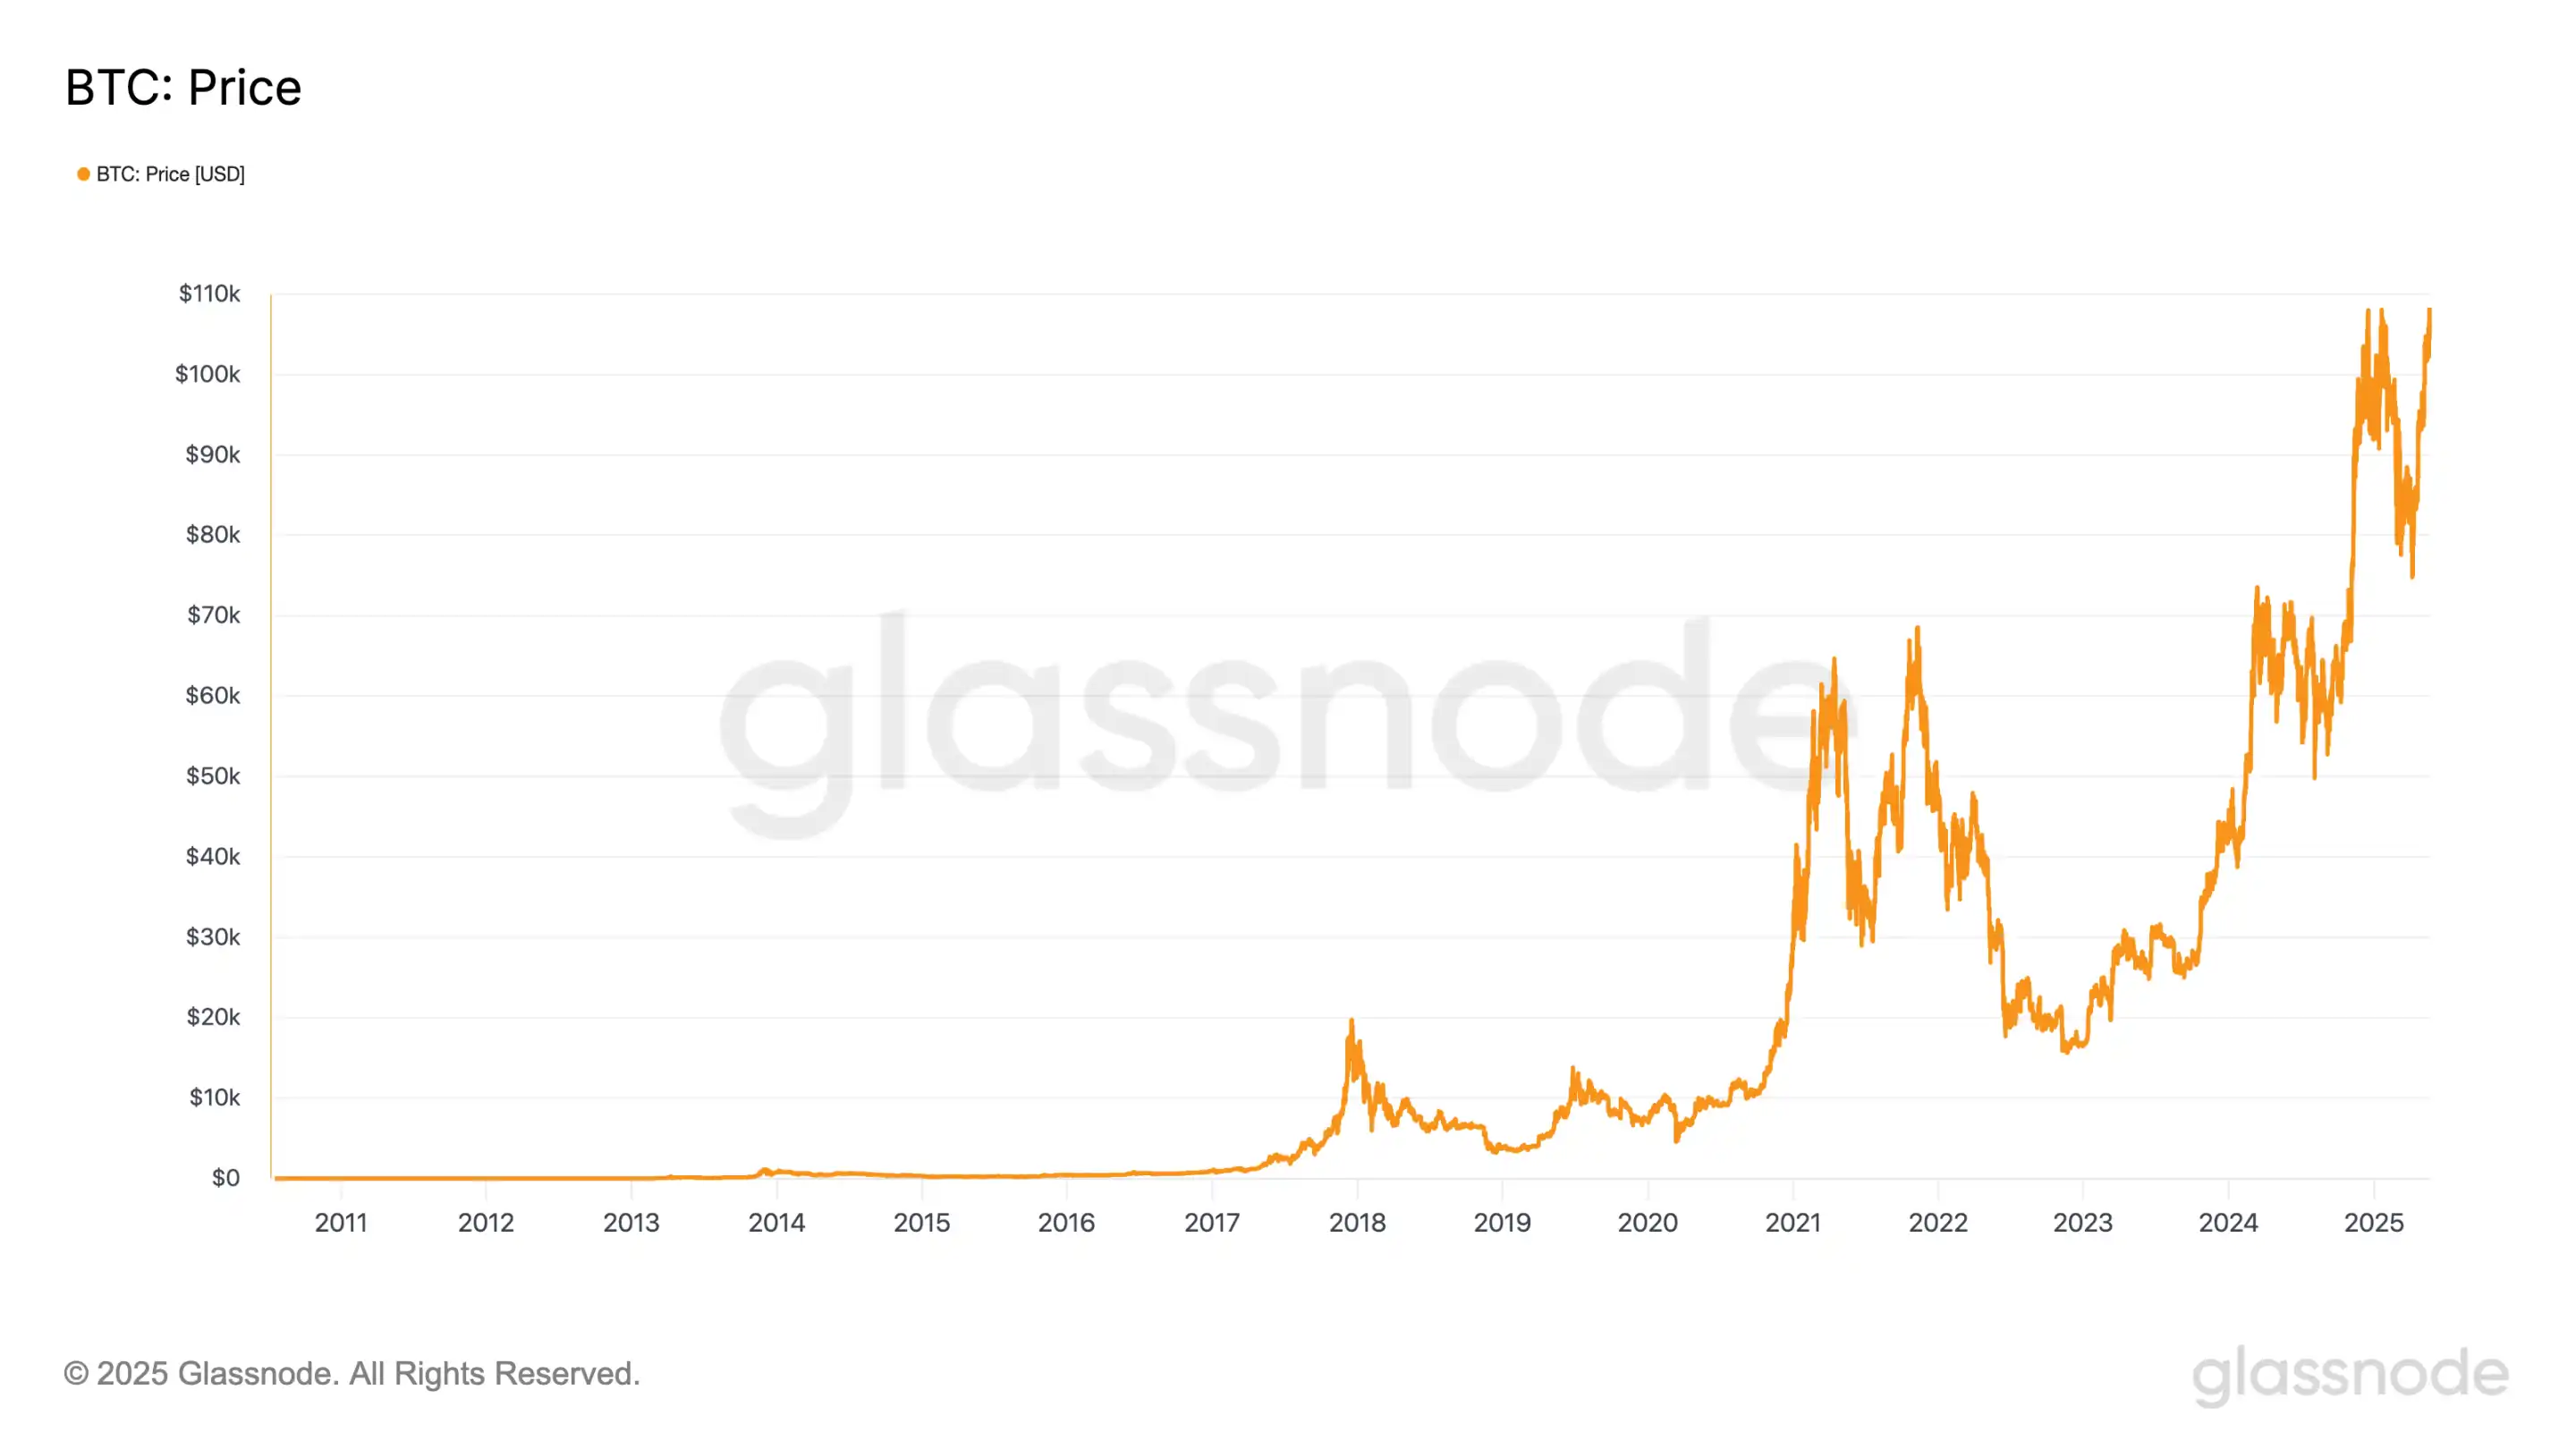
On May 22, 2025, the price of Bitcoin surged to over 110,000 USDT, breaking the historical high of 109,599 USDT on January 20. This scene couldn't help but remind people of that moment in November 2021. Back then, Bitcoin briefly surpassed the early year high before quickly falling back, initiating a long and profound bear market cycle. Now, the market seems to be once again at the turning point of fate: will it break through again, opening up a new round of upward momentum, or will history repeat itself, entering a double-top market after a "fakeout," ultimately leading to a deep retracement?
This is a question that Bitcoin cannot avoid every time it approaches an all-time high. In the past few bull markets, we have repeatedly seen a similar structure: as the climax approaches, market sentiment becomes exuberant, and discussions about whether the "cycle peak has arrived" abound. However, this time around, although the uptrend and pace seem familiar, the deeper market structure has undergone significant changes.
While prices are repeating, the market is not the same as before. In this context, should we continue to believe that the "halving-driven" cycle still dictates Bitcoin's fate? Or should we acknowledge that a new rhythm has quietly unfolded in ETF funds, on-chain structures, and macro narratives?
Returning to the most fundamental observation methods, perhaps on-chain data, historical mirrors, and behavioral traces can still provide us with some kind of cyclical insight. Is this current surge the final sprint of cyclical inertia, or a new starting point after reconstructing the cycle structure? Perhaps the answer lies in the pulse of the data.
Is the Market Repeating Historical Paths?
Bitcoin's historical price trends, although volatile, can generally be divided into the following typical cycles of "halving-driven + bull/bear rotation":

Since 2011, Bitcoin's price has always evolved according to the logic of "halving-driven - supply-demand imbalance - bull market eruption - top retracement." Each cycle has ended with a higher price peak, and the double-top structure in 2021 is undoubtedly the most alarming lesson to learn from.
In April 2021, Bitcoin first reached a phased high, driven by multiple bullish factors such as the positive impact of Coinbase's listing, continued loose monetary policies, and ongoing accumulation by Grayscale's GBTC. Market sentiment was high, and the price broke the $60,000 mark for the first time. However, this high point did not last long. In May, as the Federal Reserve signaled tapering and rate hikes, combined with the policy risks of China's large-scale shutdown of domestic mining farms, the Bitcoin market quickly entered a retracement, dropping to around $30,000 in less than three months, completing a significant mid-cycle correction.
A few months later, the market gradually digested the negative sentiment as summer came to an end and experienced a bottom bounce. With El Salvador officially adopting Bitcoin as legal tender, escalating global inflation concerns leading some investors to view it as a potential hedge, and the strong optimistic expectations in the market for the approval of the first U.S. Bitcoin futures ETF, a positive narrative and inflow of funds gathered momentum. The market regathered its upward momentum and briefly surged above the historical high around $69,000 on November 10, then quickly retraced, forming a clear, multi-month "double top structure" together with the high point in April.
Ultimately, this triple resonance of price reaching new highs, active on-chain realization, and shrinking demand formed a typical "fakeout" pattern. Bitcoin quickly retraced after a brief peak, signaling the start of a downward cycle. This structure presented a technical form of "local peak + volume divergence + swift reversal," a typical double-top signal, providing an important lesson for the current market approaching historical highs.
Will History Converge?
The current trend's slope and pattern are quite similar to the eve of November 2021. More notably, multiple on-chain indicators are releasing signals of structural convergence.
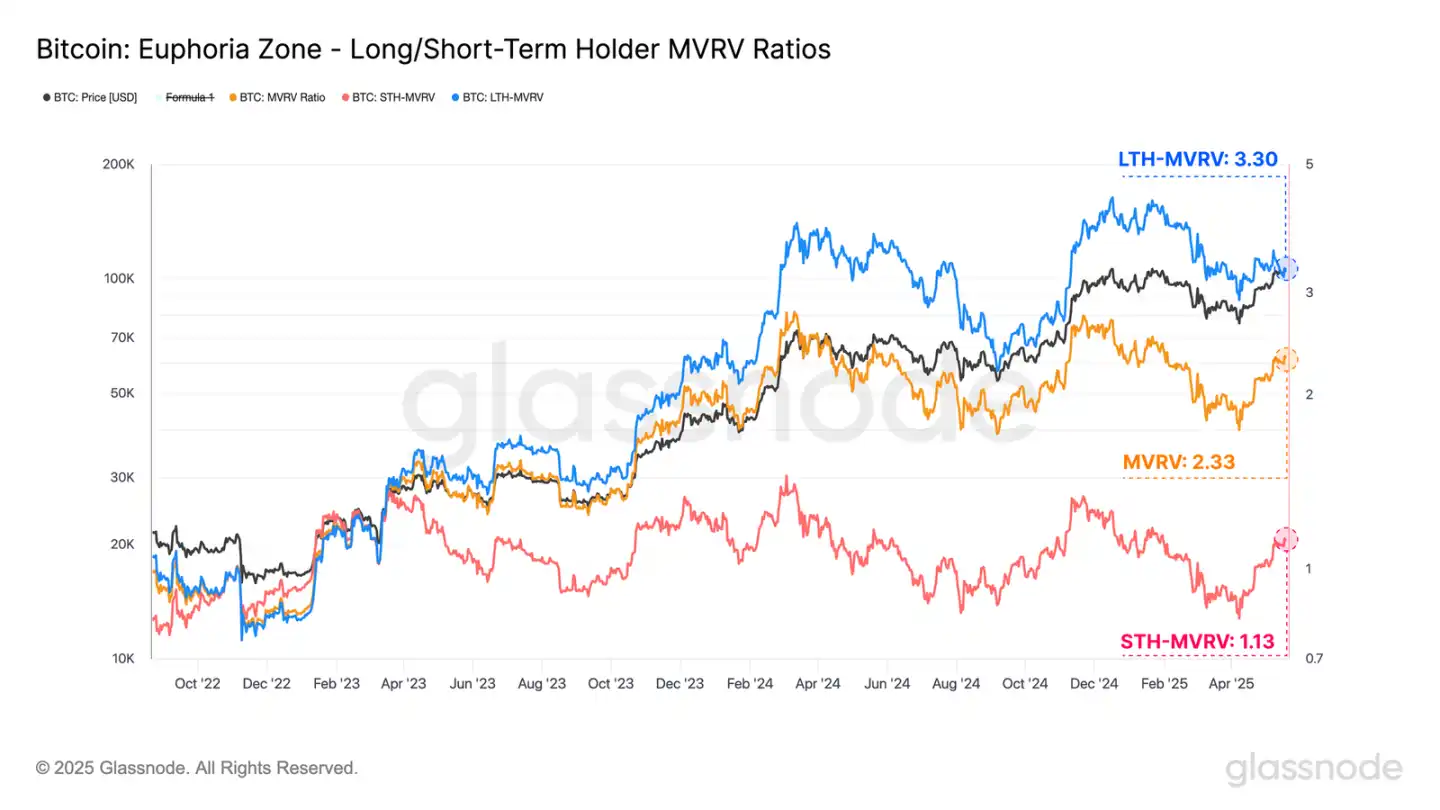
The latest data shows that the MVRV of long-term holders has climbed to 3.3, approaching the "Greed Red Zone" defined by Glassnode (above 3.5); the MVRV of short-term holders has also surged from a low of 0.82 to 1.13, indicating that the majority of short-term funds in the market have re-entered profit-taking territory. This structural shift, from a behavioral finance perspective, is a necessary condition for forming top-side pressure: as the vast majority of investors return to profit, the desire to cash out often strengthens in sync.
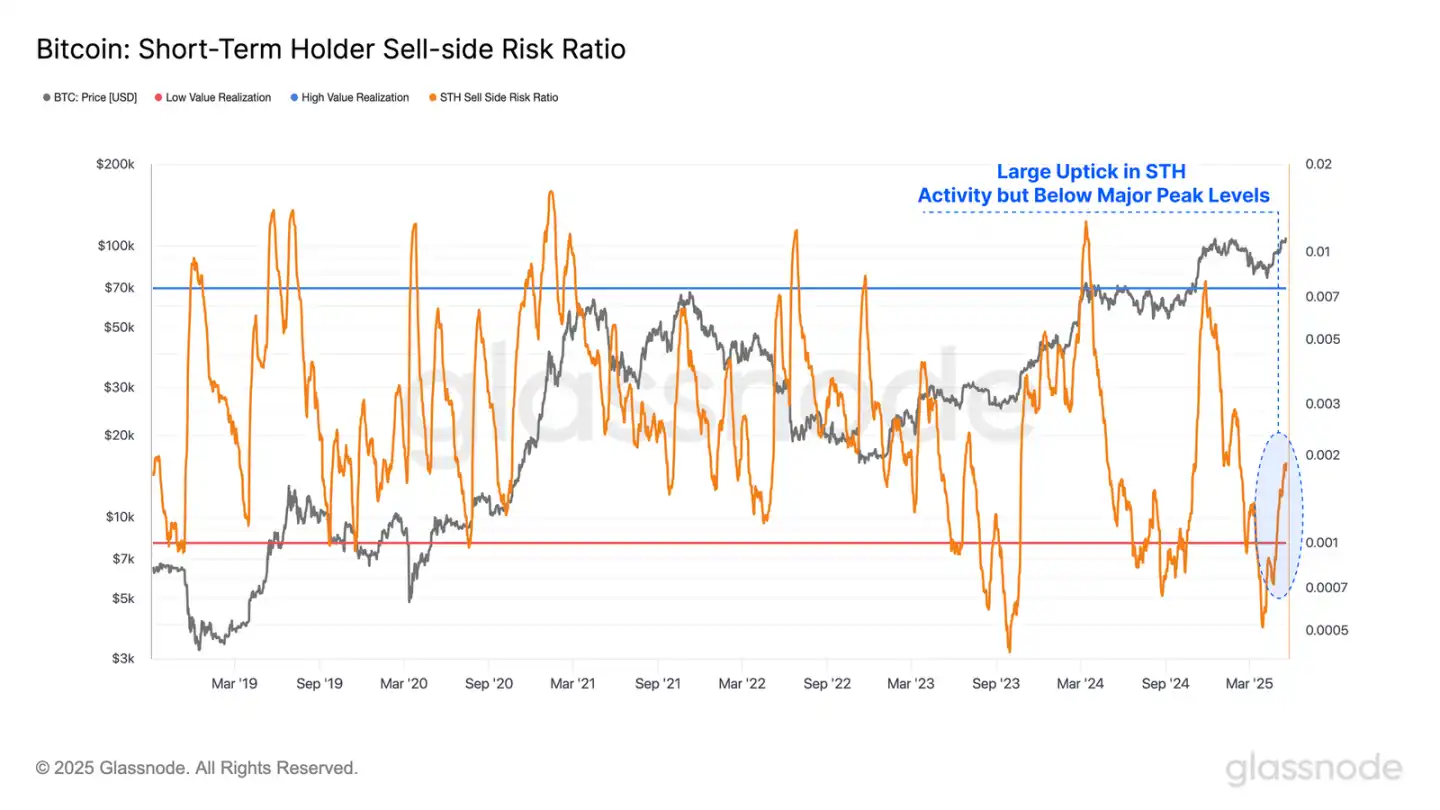
However, when we analyze the situation from the perspective of "seller behavior pressure" on-chain, although the sell-side risk ratio of short-term investors has significantly increased, indicating some profit-taking actions on-chain, the overall figure still remains at a historically moderate to low level. This state reflects that despite the warming investor sentiment, some funds choose to take profits in the profit zone, the overall market has not yet entered an imbalanced state dominated by "collective realization momentum."
This suggests that while upside potential may face some initial suppression, the market has not spiraled out of control. As long as liquidity remains stable going forward, the market still possesses the conditions for a continuation of structural upward movement, rather than being pushed to an ultimate peak.
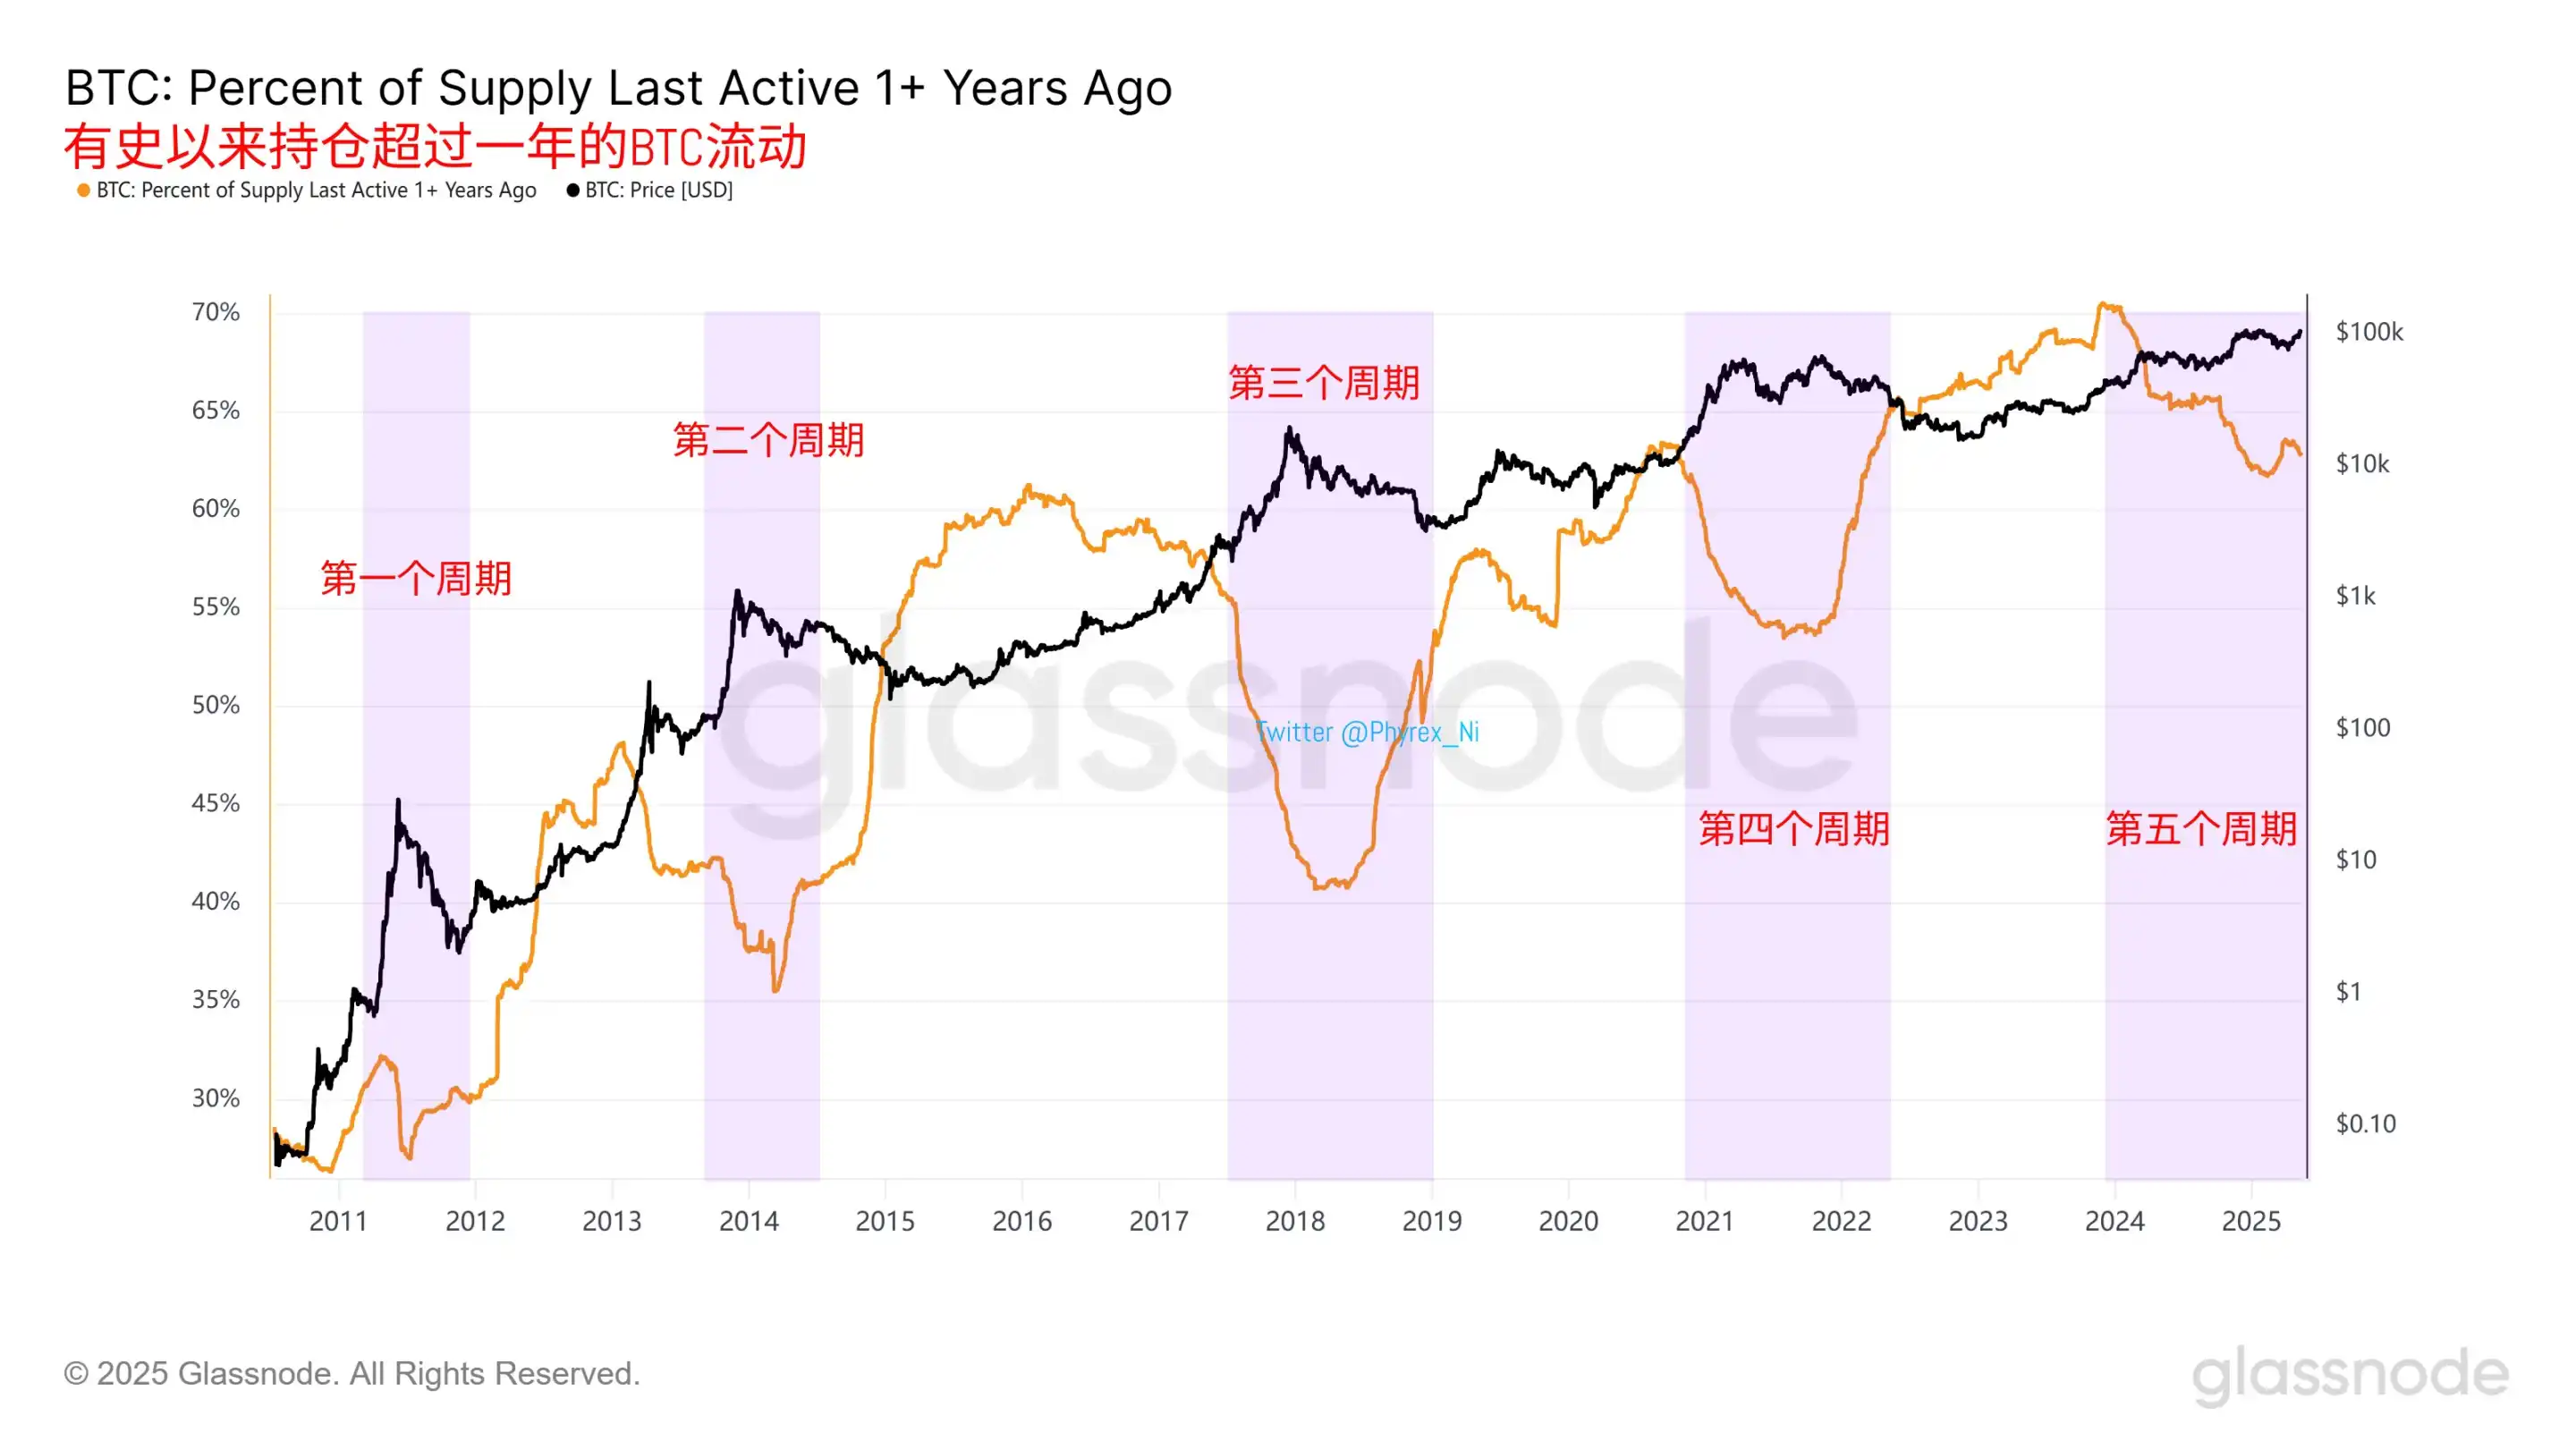
Overall, the behavior of long-term holders has always been the most reliable slow-variable signal in Bitcoin cycle analysis. Whether it's 2013, 2017, or 2021, almost every endpoint of a major bull market has been accompanied by a distribution from these holders, and a new bull market cycle often begins with their re-accumulation.
The current market has entered Bitcoin's fifth major cycle. If long-term holders have not yet started accumulating positions in this new cycle, it may indicate that the market is still in the top range or is still forming a high-level double top structure.
What Is the Future Trend?
According to on-chain analyst @Murphychen's calculation method, BTC's MVRV is used to evaluate the market because MVRV fundamentally represents the relationship between capital and cost.
Bitcoin has always followed the principle of MVRV and significant price-level divergence over the past decade. That is, once a higher price but lower MVRV deviation occurs, the subsequent indicator cannot surpass the previous high, and the price's upward potential is then suppressed. The logic behind this is that as the cost basis increases, pushing the price even higher requires an exponential increase in capital.
This cycle's highest MVRV point occurred on March 11, 2024, with a Bitcoin price of $72,000 and MVRV of 2.78. Subsequently, whether it was December 17 or January 21, although the BTC price hit new highs, the MVRV never exceeded 2.78. Therefore, for BTC to reach new heights in this cycle, the first and most crucial step is to break the significant MVRV divergence. Based on the current RP dynamic value, it is estimated that the BTC price needs to surpass $125,500.
Welcome to join the official BlockBeats community:
Telegram Subscription Group: https://t.me/theblockbeats
Telegram Discussion Group: https://t.me/BlockBeats_App
Official Twitter Account: https://twitter.com/BlockBeatsAsia