Bitcoin price hovering around 34,000, can market makers continue to boost it?

The original author: Chris Newhouse@CryptoDeFiGuy
Translation: Joyce, BlockBeats
Editor's note:
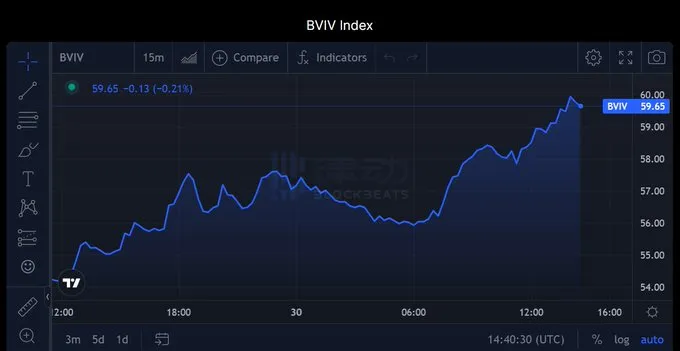
In the past week, the price of Bitcoin has been fluctuating around $34,000 after reaching $30,000. It is not yet clear whether the price of Bitcoin will continue to rise after the adjustment. According to the BitVol (Bitcoin volatility) index chart, Bitcoin option traders in the market are more concerned about the volatility of Bitcoin prices and expect larger price fluctuations in the future.

Last week, Galaxy Research's research director@intangiblecoins pointed out that as the BTC spot price rises, more and more Bitcoin option market makers are shorting gamma, so in the short term, due to the gamma squeeze, the price of Bitcoin is easy to rise and difficult to fall significantly.
BlockBeats note:
Gamma is an indicator in option trading that represents the sensitivity of option prices to changes in the underlying asset price, and also measures the speed at which hedging positions need to be adjusted.
Gamma squeeze refers to the phenomenon that due to the accumulation of gamma risk in option trading, market makers or option holders need to continuously buy or sell the underlying asset, thereby pushing up the price of the underlying asset.
Some analysts believe that "gamma squeeze" may occur again this week. Chris Newhouse, a risk analyst at AlphaLab Capital, a cryptocurrency investment institution and market maker, shared his insights. BlockBeats compiled the following:
After spending some time researching pricing, hedging, trading, and entering the field of cryptocurrency options, I believe it is a good time to raise some questions as an opportunity to learn and clarify some of the "gamma squeeze" phenomena that have already emerged.
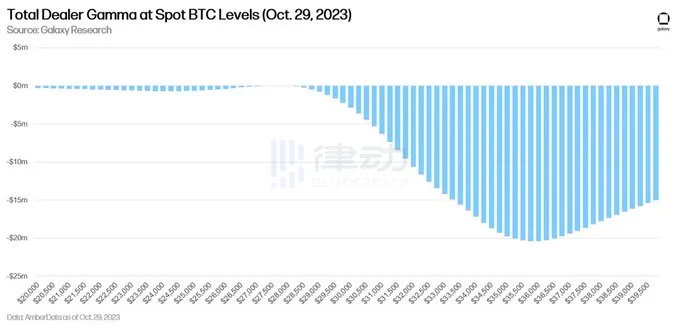
Preliminary information: I believe that @Amberdata's method for identifying "Dealer Gamma" from retail option flows is rigorous enough. I have been using their charts for years. Note: Dealer Gamma exposure only makes sense when you can confidently assume that the DEALER is marked.
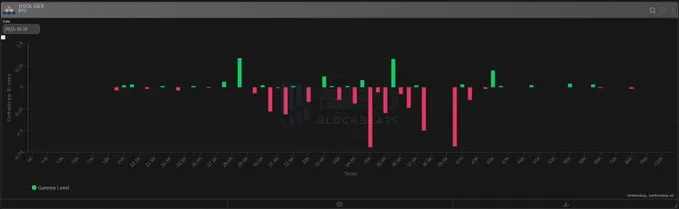
The reason why this is so important is because traders are assumed to hedge their potential risk exposure, therefore their potential flow can be seen as a catalyst for price changes. There are several things to consider when managing delta hedging and gamma exposure.
1) Passive and Active Orders
3) Over-the-counter/bilateral trading with another counterparty/trader.
4) Determine the funding rate for spot/futures/perpetual contracts.
5) Specific hedging parameters, such as underlying asset percentage changes or time since last hedging.
6) Market fluctuations/opinions
No one will constantly hedge their increments every second.
This chart explains the astonishing amount of delta that traders need to buy for every 1% increase. It provides a visual representation of the numbers needed for risk hedging and also helps visualize the degree of increase in gamma risk.
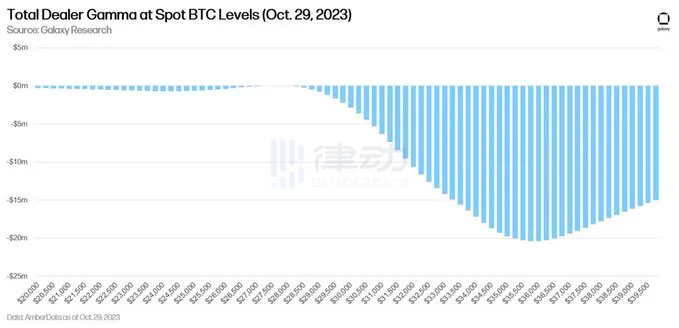
This is not just a single entity, but the sum of gamma exposures marked, which means that although hedging of $X may occur at different levels, each trading entity differs in the timing and execution of hedging, as well as the weight they place on certain factors.
There won't be a group of traders saying "Hey guys, everyone get ready to buy our delta hedge at $32". The transparent flow of trades and differences in hedging parameters mean that while we know some hedging flow will occur, we don't know how or when it will happen.

Given that last week's large-scale changes occurred mainly within a day, it is pointless to argue whether the chicken or the egg came first. There were various factors that drove this initiative, and the hedging of trading firms' gamma risk undoubtedly played a role.
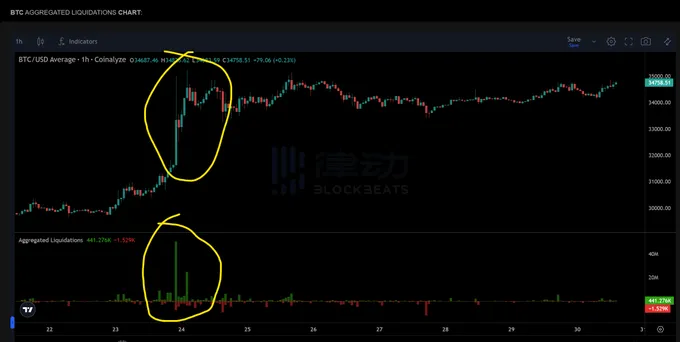
However, it is controversial whether "gamma squeeze" may occur again this week. The gamma exposure of traders has increased, and the subsequent trend of spot prices may bring some forced hedging flow again.
However, there were several factors last week that had other impacts. The gamma exposure of traders last week may have been the spark that ignited the powder keg - the powder keg being clearing, leveraged long demand, and spot chasing.
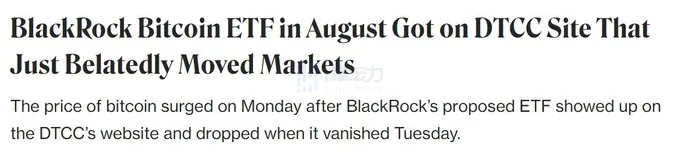
It is important to recognize that positions in the perpetual futures market (clearing), natural spot demand, and any potential events (such as last week's DTCC content) must also exist in order to see explosive phenomena such as 10% fluctuations in a single day.
Thank you @Amberdataio, @volmexfinance, @CoinSharesCo, and @glxyresearch for providing the charts.
Welcome to join the official BlockBeats community:
Telegram Subscription Group: https://t.me/theblockbeats
Telegram Discussion Group: https://t.me/BlockBeats_App
Official Twitter Account: https://twitter.com/BlockBeatsAsia

 Related Articles