Glassnode: The on-chain data shows that Bitcoin is transitioning into a new cycle

原文标题:《 Glassnode :链上数据显示比特币正过渡到新一轮周期 》
Original article by UkuriaOC, Glassnode
The DeFi way
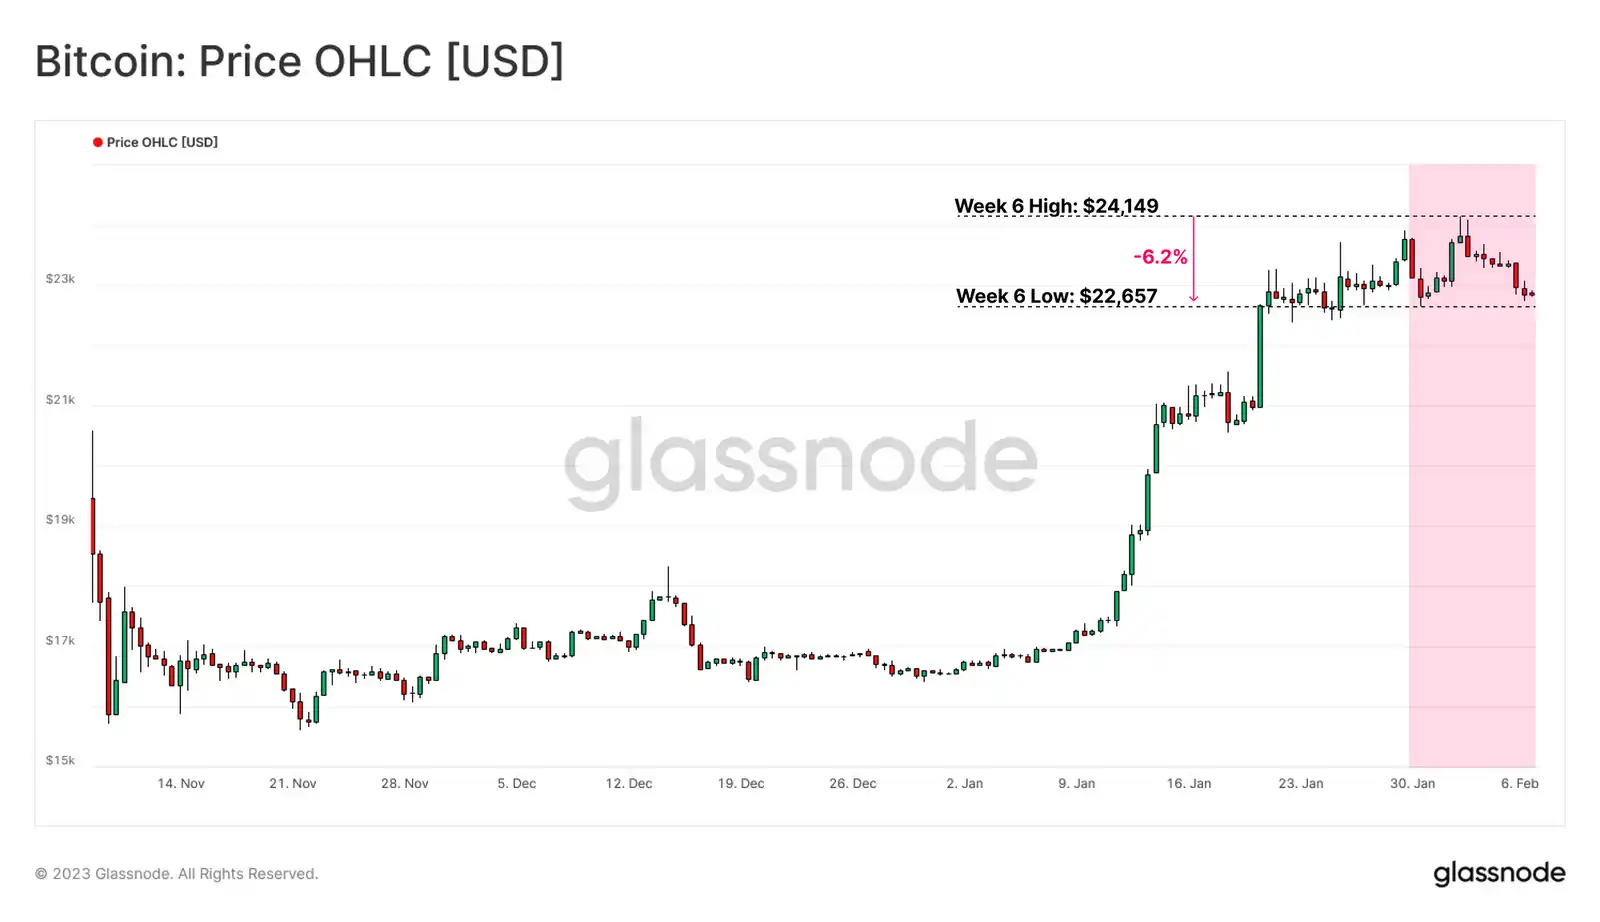
After a volatile month, the price of Bitcoin is climbing back above the on-chain cost basis of several groups. Despite a 6.2 per cent pullback in BTC to a weekly low of $22,600, the average holder's account is now in the black and several macro-chain indicators suggest the market trend may be shifting.
In this period of data analysis, we will explore this in terms of consumer activity in response to recent price increases, with the goal of identifying emerging patterns of behaviour to gauge changing macro trends. We will also investigate whether the incentive to sell starts to outweigh the opportunity cost of HODLing as capital begins to change hands (how do we identify this shift) and the relationship between established players and new players.
Return to profitability
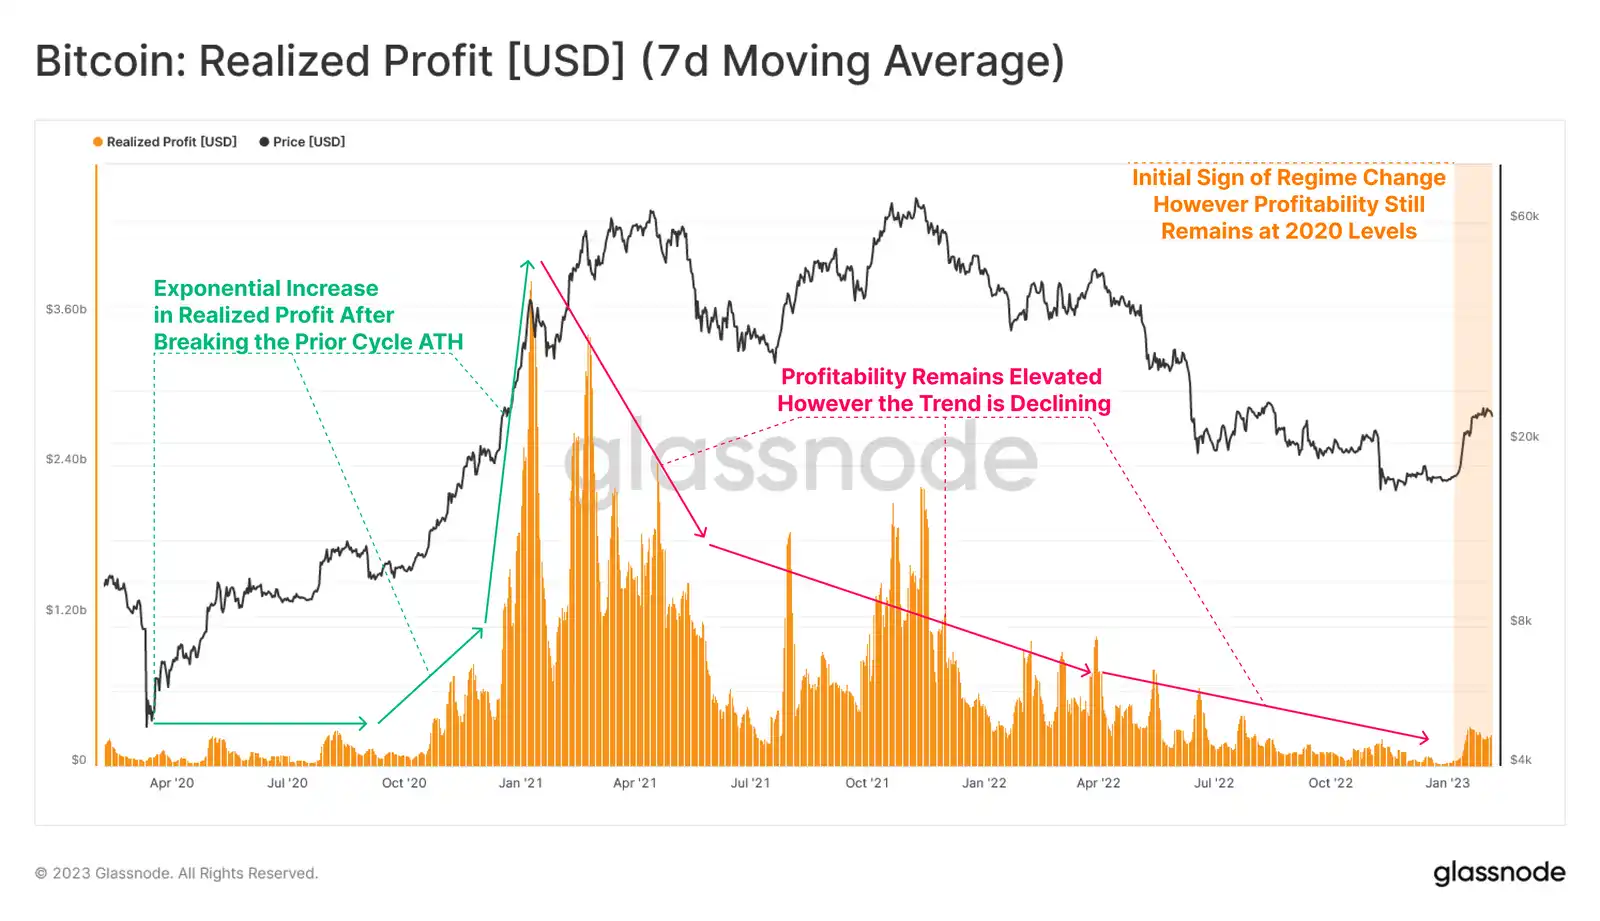
We will begin our investigation by analyzing realized profits that the market has locked in during the most recent cycle. We can see a surge in profit taking after October 2020 due to monetary policy anomalies. As you can see, this situation has decreased dramatically since its peak in January 2021, returning to 2020 levels within the following two years.
The recent price action reflects a recovery in realised profits, but it remains bleak against the boom experienced throughout the 2021-22 cycle.
Live Advanced Chart
The losses realized by the market in the same time frame began to widen after January 2021 and reached an initial peak in the May 2021 sell-off.
However, we can see that the current realized loss level has dropped to a baseline cycle of about $200 million/day, with the loss profile contracting overall, unless there is a clear capitulation event (e.g. LUNA/FTX).

Live Advanced Chart
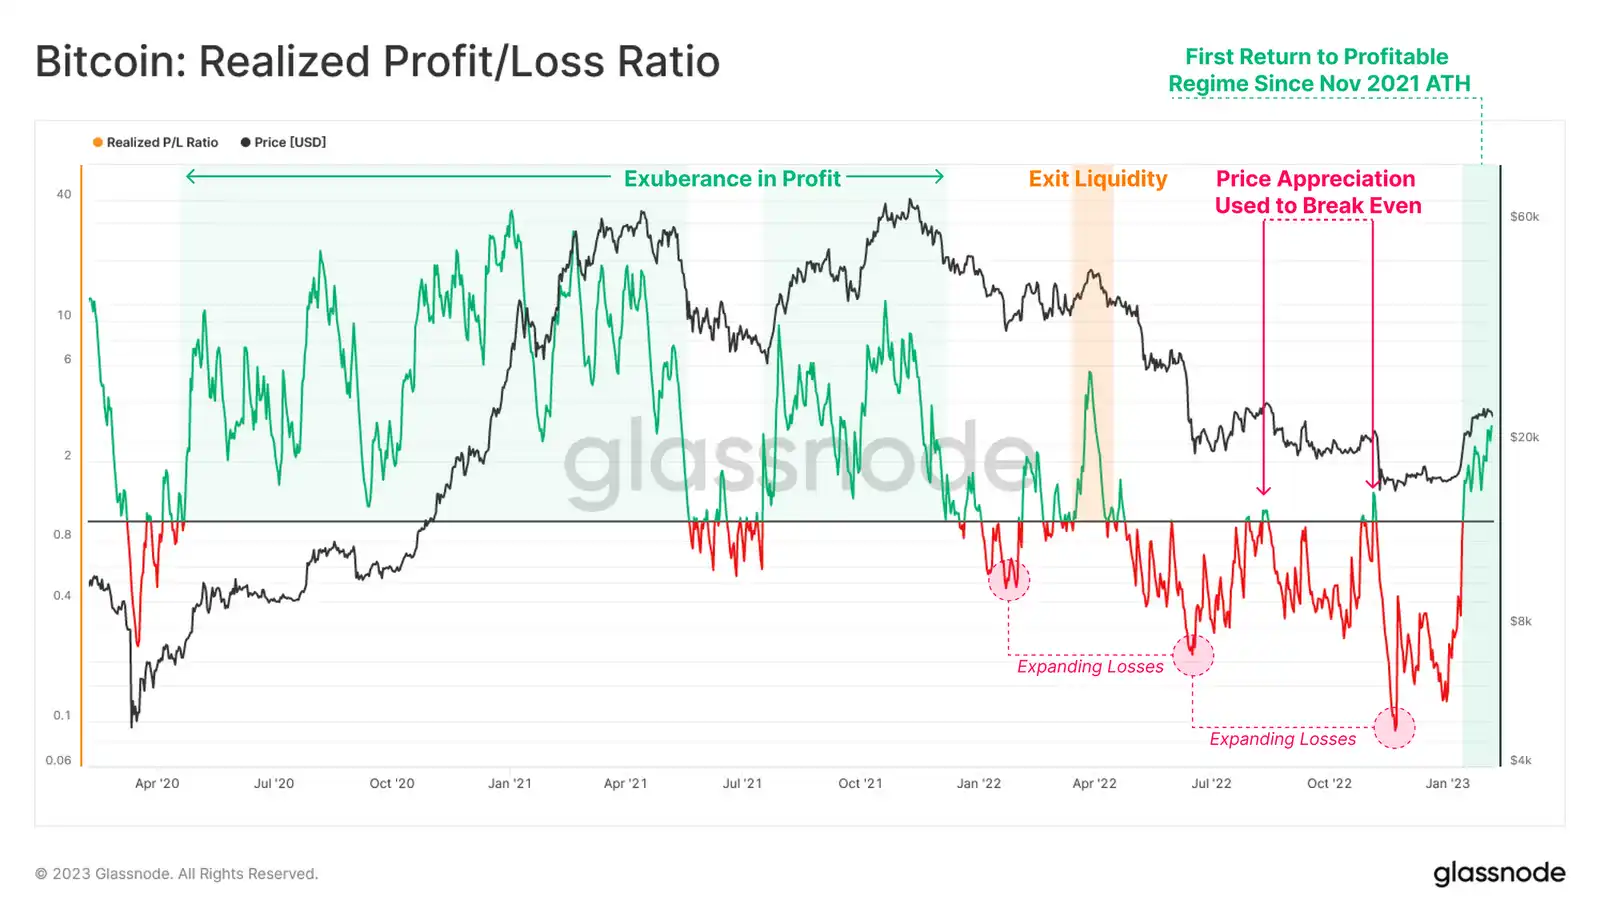
By calculating the ratio between realized profits and losses, we can identify structural changes in dominance between the two. After the market reached ATH in November 2021 and the price action collapsed, a loss-dominated regime followed, pushing the realized break-even ratio below 1 and increasing in severity with each subsequent price action capitulation.
Nonetheless, we can observe the first sustained earnings period since the exit liquidity event in April 2022, indicating the first signs of a change in the profitability regime.
Live Advanced Chart
The Bitcoin Sell-Side Risk Ratio is a measure we can use to compare total realized profits and losses as a percentage of realized market value (a measure of network valuation).
From this perspective, the total amount of realized profits and losses is still relatively small compared to the size of assets. This suggests that the scale of the spending event remains small, particularly relative to the euphoria and FTX capitulation experienced during the bull market.
Overall, this suggests that most of the coins that are moving, are being acquired relatively close to the current spot price, and therefore do not lock in a large number of "realized" payloads.

Live Advanced Workbench
Rise again
The net unrealized profit and loss ratio (NUPL) shows that the recent rally has pushed the spot price of bitcoin above the average acquisition price in the broader market. This puts the market back into a state of unrealized profits, where the average holder is back in the black.
Comparing the duration of negative NUPL in all past bear markets, we observe historical similarities between the current cycle (166 days) and the 2011-12 (157 days) and 2018-19 (134 days) bear markets. The 2015-16 bear market still stands out in terms of duration, with unrealised losses almost twice as long as the runner-up's (2022-23 cycle).

Live Advanced Workbench
The ratio of total unrealised profits held by the market to its annual average can provide a macro indicator of a recovering market.
The recent surge in price action, which has outstripped several convergent on-chain cost-based models, has resulted in a significant improvement in the financial position of the market. This momentum indicator is now approaching an equilibrium turning point, similar to the recovery of the 2015 and 2018 bear markets.
Historically, confirmation breakthroughs to break through this equilibrium point have coincided with shifts in macro market structure. We also note that the length of time below this point of equilibrium is similar in major bear markets.

Live Advanced Workbench
A variant of the SOPR (Spent Output Profit Ratio) metric that can be used to examine the total profit multiple locked in by various market groups at any given date.
For the short-term holder group, it can be seen that STH-SOPR is now trading consistently above the value of 1.0, showing profit taking for the first time since March 2022, reflecting the large amount of BTC bought at lower prices in recent months.
The broader market has also returned to profitable spending after a long period of heavy losses.

Live Professional Workbench
Assessing the group of long-term holders, we can observe a continuing state of losses since the LUNA debacle. Although this group has continued to suffer over the past nine months, there are tentative signs of recovery and an underlying upward trend in LTH-SOPR is beginning to take shape.

Live Professional Chart
Change of role
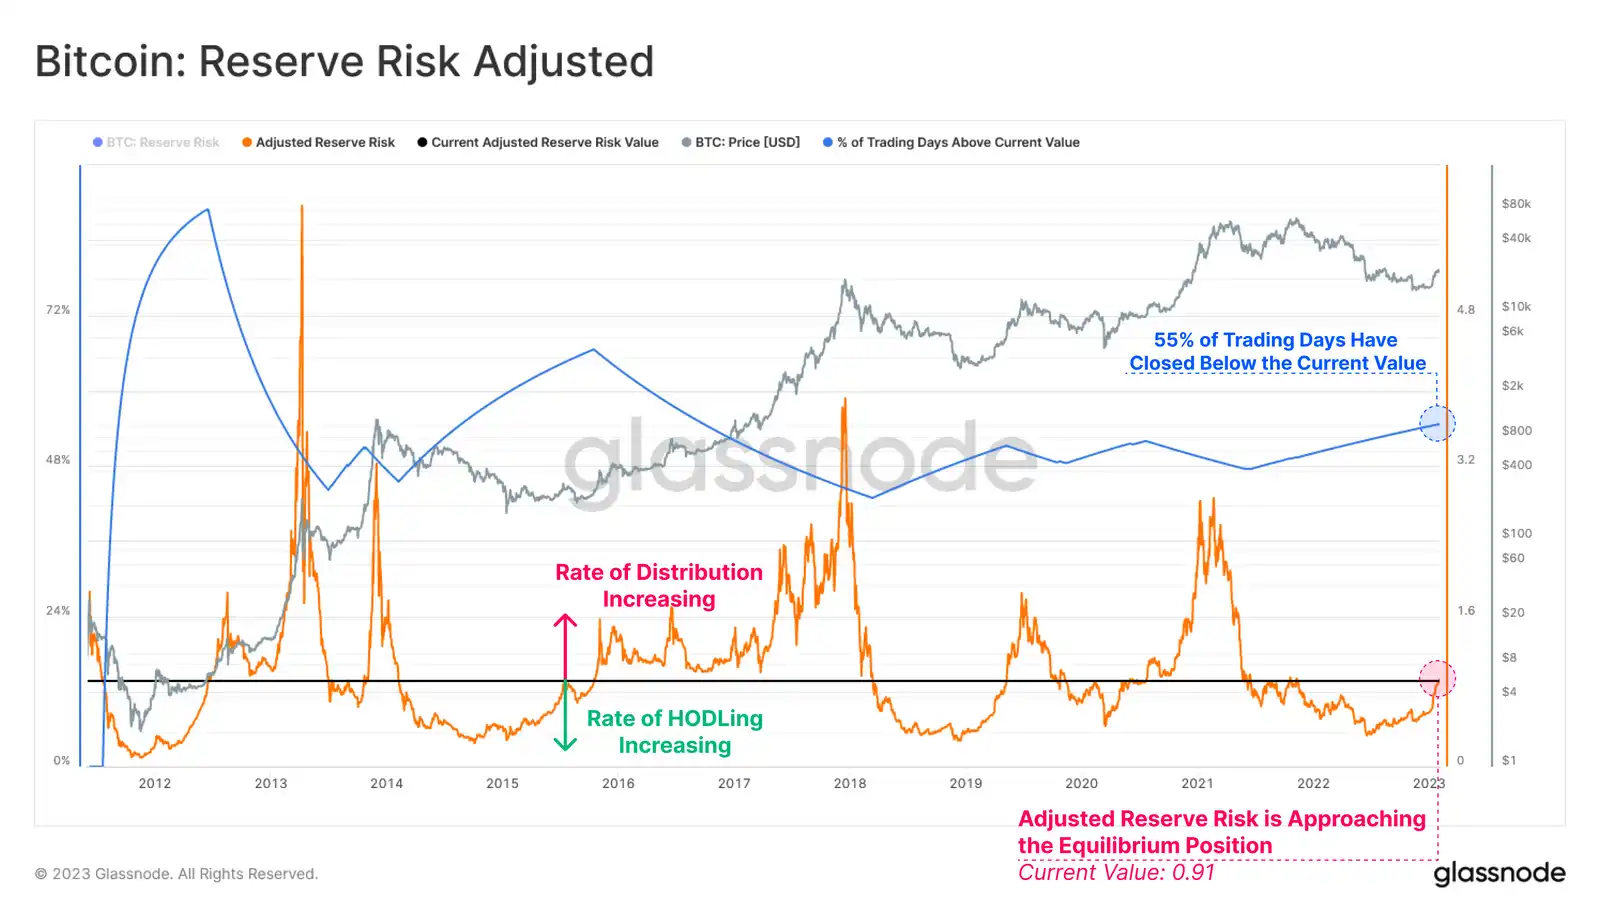
Adjusted Reserve Risk index can be used to assess changes in HODLer's behavior. This cyclical volatility indicator quantifies the balance between the total incentive to sell and the actual expense of long-dormant BTCS.
A higher value indicates an increase in both price and HODLer expenditure. A lower value indicates that both the price and HODLer spend are decreasing.
A structural change in trend appears to be underway as the indicator continues to approach its equilibrium position. This suggests that the opportunity cost of HODLing is decreasing and the incentive to sell is increasing.
Historically, the previous breach of this equilibrium position has marked the transition from a HODLing regime to one that increases profit realisation and the transfer of capital from old bear market accumulators to newer investors and speculators.
Live Advanced Workbench
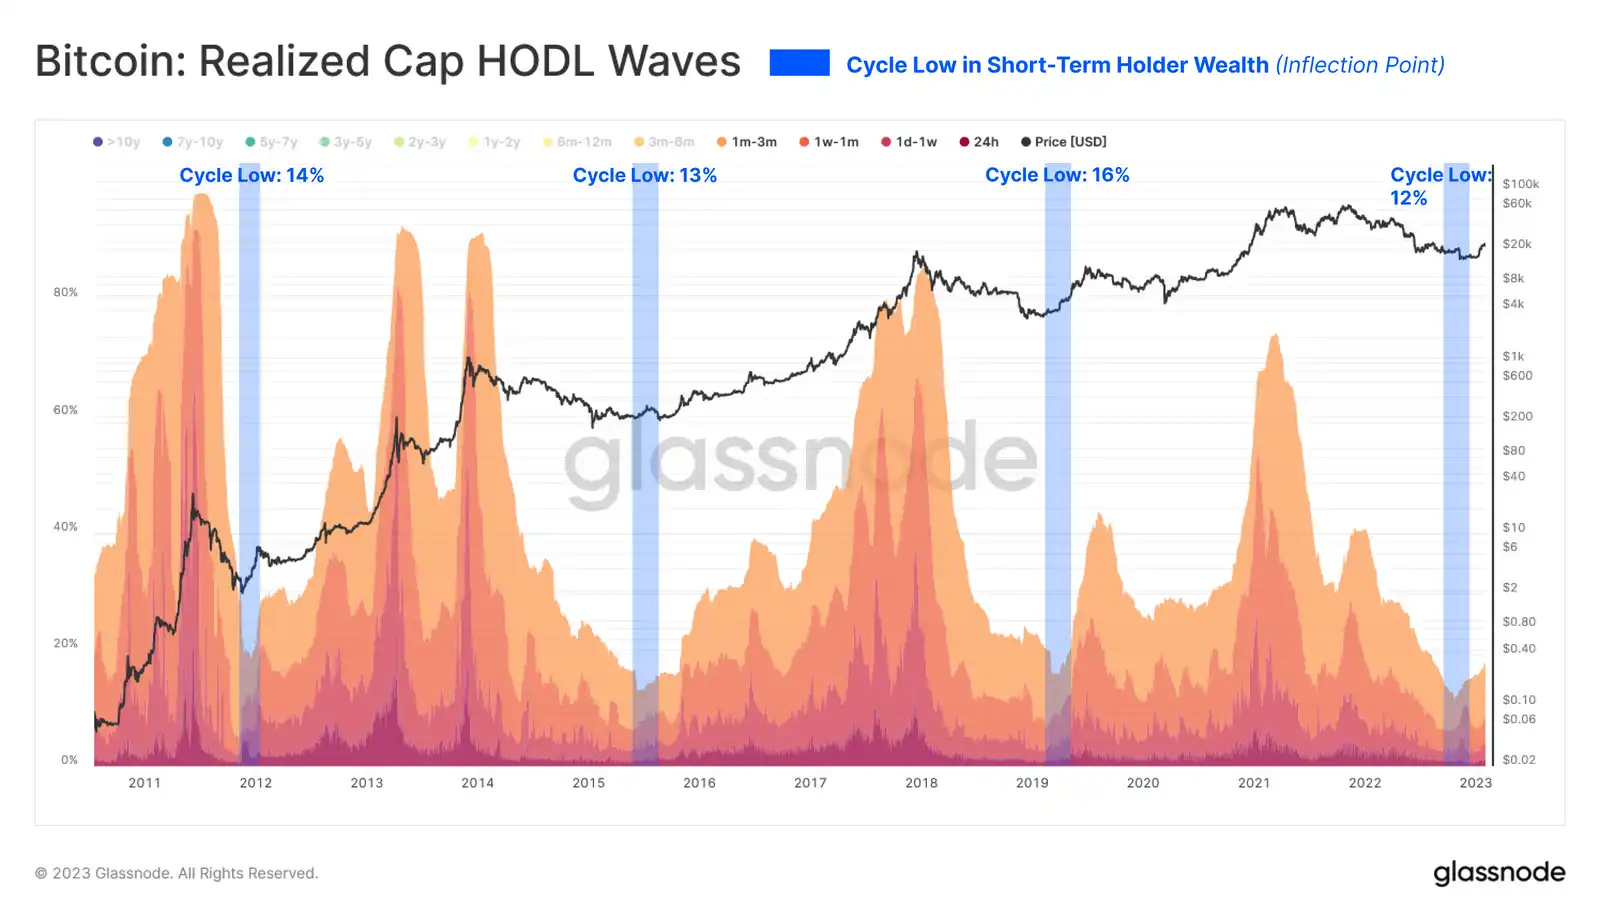
We can add weight to the capital rotation argument by examining "realized market cap HODL Waves". Here, we isolated BTCS held for 3 months or less and documented two key observations:
The share of wealth held by new holders is increasing, albeit slightly. Since this is a binary system, this suggests that wealth must be transferred from the old holders to the new holders. The depth of this inflection point is well in line with historical precedent.
Live Advanced Chart
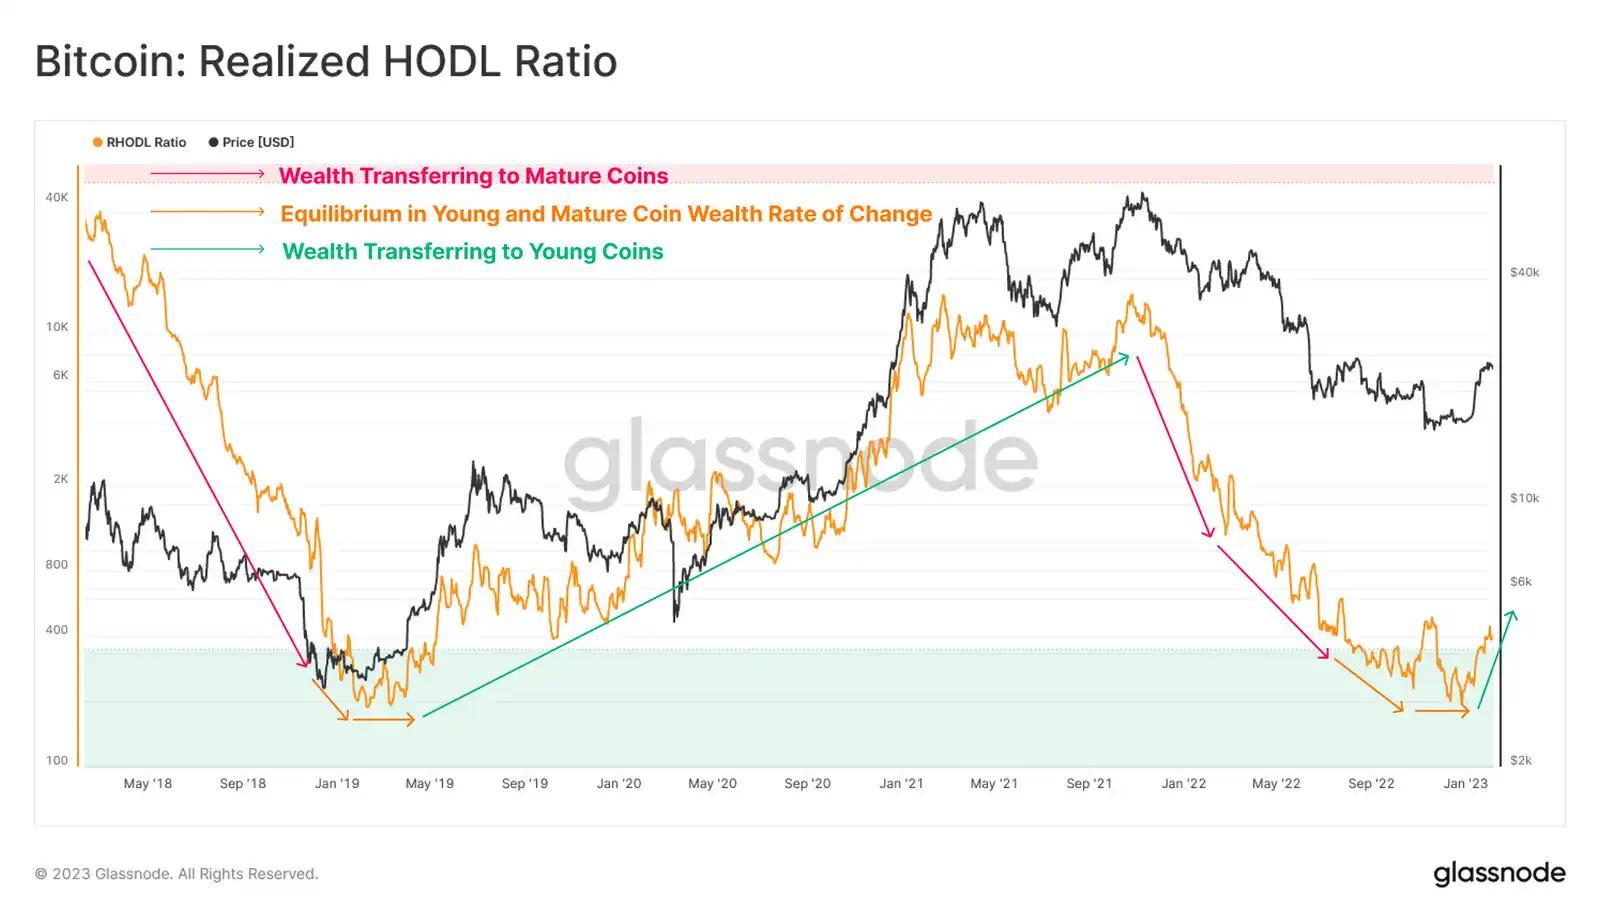
Subsequently, we can use Realized HODL ratios to further complement the above observations.
High values indicate that wealth is held disproportionately by new buyers and speculators. Lower values indicate a disproportionate amount of wealth held by the HODLer of long-term, higher convictions.
In evaluating realized HODL ratios, the rate of change and direction of the trend are usually more important than the absolute value. Currently, we are witnessing the formation of a cycle bottom structure, which indicates that a net transfer of wealth is taking place and the trend is beginning to shift upwards.
Live Advanced Chart
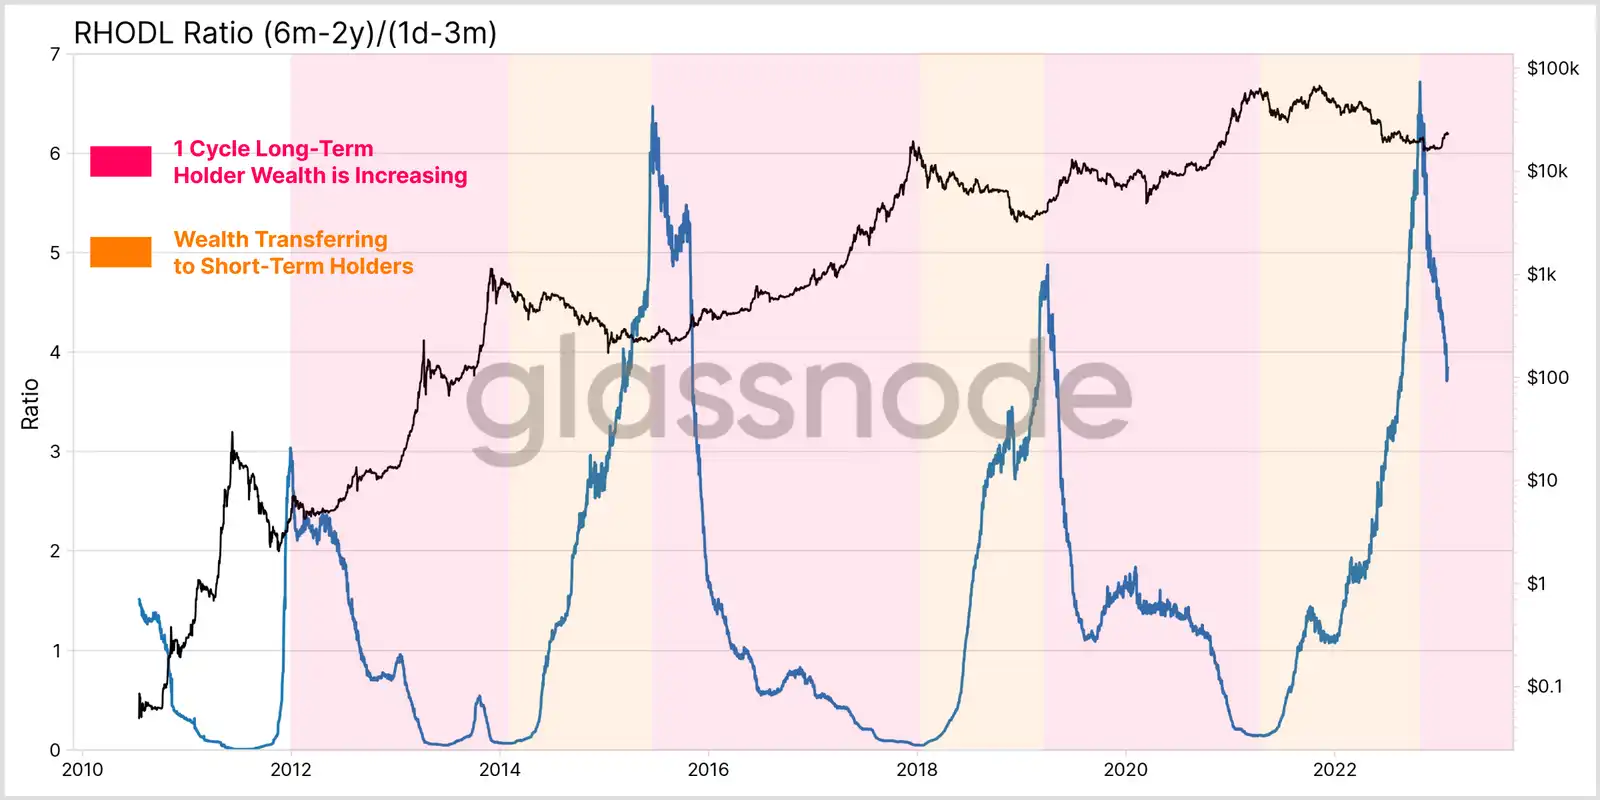
With this as a background, we can introduce a new variant of the RHODL ratio, which compares wealth held by single-cycle long-term holders (6 months to 2 years) with wealth held by the youngest short-term holders (1 day to 3 months). This aims to assess the turning point of capital rotation during the cycle transition.
Currently, we can see a large and sharp inflection point in this RHODL ratio variant, which indicates a shift of capital from the long-term holders of the previous cycle to a new group of buyers.
This market phenomenon has been surprisingly consistent in previous bear markets, with large changes in capital flows indicating significant changes in market characteristics and structure.
Summary and conclusion
After an ongoing deleveraging event, and a long, brutal bear market, there are signs that a cyclical shift may be under way.
However, it is still early days for this trend, both in terms of duration and the size of realized profits and losses relative to the size of the market. As discussed previously in WoC#45, the rotation of capital from long-term holders to short-term holders has been a consistent trend over the past 12 months. This is well reflected in the increasing wealth held by groups of short-term holders, who absorb BTCS from long-term holders, who in turn continue to allocate them to the market (often at a loss).
The market seems to be in a transitional phase, developing from the late stages of a bear market to the beginning of a new cycle. Using past cycles as a guide, the road ahead remains difficult, with 2015 and 2019 as examples. Historically, these transitional periods have been characterized by an extended macro sideways market accompanied by locally sharp two-way volatility.
Original link
Welcome to join the official BlockBeats community:
Telegram Subscription Group: https://t.me/theblockbeats
Telegram Discussion Group: https://t.me/BlockBeats_App
Official Twitter Account: https://twitter.com/BlockBeatsAsia