On-chain data analysis for the 37th week: high-quality selling pressure continues to decrease, and market purchasing power is biased towards stock

Original title: "Night Mist and Light Cage, Jiuzhe Thinking | WTR 9.12"
Original source: WatchToweR Institute
This week in review
This week from September 5th to September On the 11th, the highest value of BTC was around 21850, and the lowest value was close to 18550, with a shock range of around 16.50%.
Observing the recent chip distribution chart, a large number of chips are traded around 21200 , and there will be certain support or pressure.

Analysis:
< br>
1. 18500~20000 about 1.3 million million pieces
2. 22600~23300 about 80 million pieces
The probability of not falling below 16000~18500 is 62%.

Important news
< /p>
United States
1. Beginning this month, the balance sheet of the Fed plan The reduction will double the initial level in June to $95 billion a month.
a. The Federal Reserve's balance sheet reduction and interest rate hike will lead to the drying up of liquidity in the global market.
2. Total global capital inflows in August increased by US$2.5 billion month-on-month to US$49.4 billion. U.S. stocks led the gains, with net inflows jumping to $30.2 billion from $12.6 billion in July.
3. The 10-year U.S. Treasury yield rose to 3.34% this week, and the 30-year U.S. Treasury yield soared to its highest level since 2014.
4. While the Fed is raising interest rates, employment remains strong and some wage gains in the US have reached record highs. Judging from the current market data, the possibility of a sharp recession in the US economy is very small.
Europe & UK
1. The European Central Bank raised interest rates by 75% to 0.75%, and made a significant downward revision to the economic growth for the rest of 2022 and the whole of 2023.
2. Investors are withdrawing money from European ETFs at the fastest pace. BlackRock data showed $7.7 billion was withdrawn from the sector, the sixth straight month of net outflows from the sector.
3. European investors have shifted from underweight US stocks in 2018 to overweight now.
4. UK benchmark 10-year government bond yields rose to 3.1%, touching 3% for the first time since 2014.
5. British savers have fled funds investing in British companies and have withdrawn 6.6 billion pounds from these assets, the largest year of outflows in 10 years.
a. Data from industry body Invest in the UK showed a 12-month streak of net outflows. The yield curve shows that the market is pricing in a recession.
Asia
1. ; The central bank announced that starting from September 15, 2022, the foreign exchange deposit reserve ratio of financial institutions will be lowered by 2%, and the foreign exchange deposit reserve ratio will be lowered from 8% to 6%.
2. The yen fell further to 144 yen to the dollar on Wednesday, a 24-year low.
Encryption Market
1. Financial Institutions HANetf: A survey of 75 wealth managers in the UK and Europe shows that despite the decline in cryptocurrencies, 75% of respondents still expect to increase their exposure to cryptocurrencies in the next year.
2. The Finbold ROI data report shows that Bitcoin's five-year investment return exceeds that of five bank stocks including Citigroup, Wells Fargo, Goldman Sachs, Bank of America, and JPMorgan Chase.
a. Bitcoin's performance was seen as a surprise, with the top cryptocurrency challenging decades-old financial institutions.
3. In order to improve the user's liquidity and capital utilization efficiency, Binance will automatically convert the user's existing USDC, USDP, TUSD stablecoin balance and new recharge at a ratio of 1:1 to BUSD. Binance launched the first soul-bound BAB Token on BNB Chain.
4. EIP official website shows that the EIP-3525 proposal status is "Final", which also means that the proposal has been passed and officially accepted as a new Token standard ERC-3525 .
a. This standard was proposed by Solv Protocol, which defines "semi-homogeneous token (SFT)" for the first time, a unique and powerful self-description like NFT Capability, and a new asset carrier on the chain with the advantages of homogeneous certificates that can be split and high liquidity.
5. Report: Belgium, Iceland, Israel, the Philippines, and Japan are the countries with the strictest encryption tax policies.
Long-term insight: used to observe our long-term situation; bull market/bear market/structural change/neutral state
Mid-term exploration: used to analyze what stage we are in, how long this stage will last, and what situation we will face
Short-term observation: used to analyze the short-term market situation; and the possibility of some direction and certain event occurring within a certain premise
Long term insight
The impact of potential selling pressure on investors and trading platforms for more than one year
The net position status of long-term investors
High-quality selling pressure status< /p>
(the picture below the impact of potential selling pressure on investors and trading platforms for more than one year)

The blue area is the potential impact of selling pressure on the trading platform
The red area is the current situation
As shown in the figure above, when the potential selling pressure impact of the trading platform is high, it generally faces a phased top.
It has been highlighted many times in history.
The current stage is the stage of potential accumulation of trading platforms, and the overall potential strength is similar to that in the first half of 2020.
(The picture below high-quality selling pressure state)
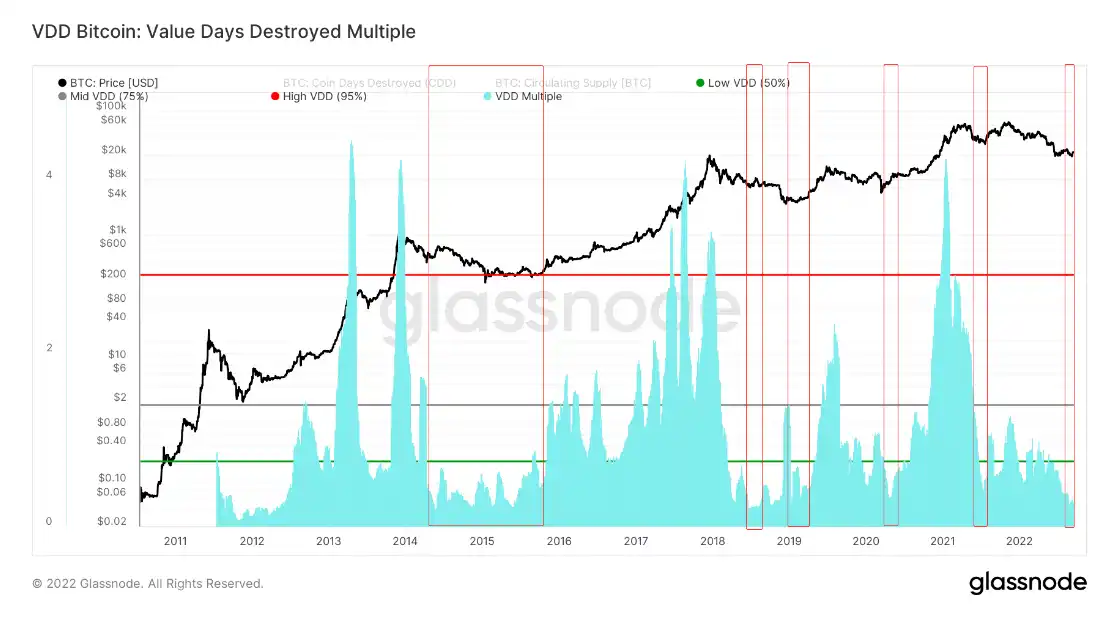
The red area is the lower area of high-quality selling pressure
In the history of high-quality selling When it is lower, it usually means that a market is at a lower position from a macro point of view.
The high-quality selling pressure at this stage has reached a three-year low.
In these processes, the performance of long-term investors is also relatively prominent.
(The net position status of long-term investors in the figure below)
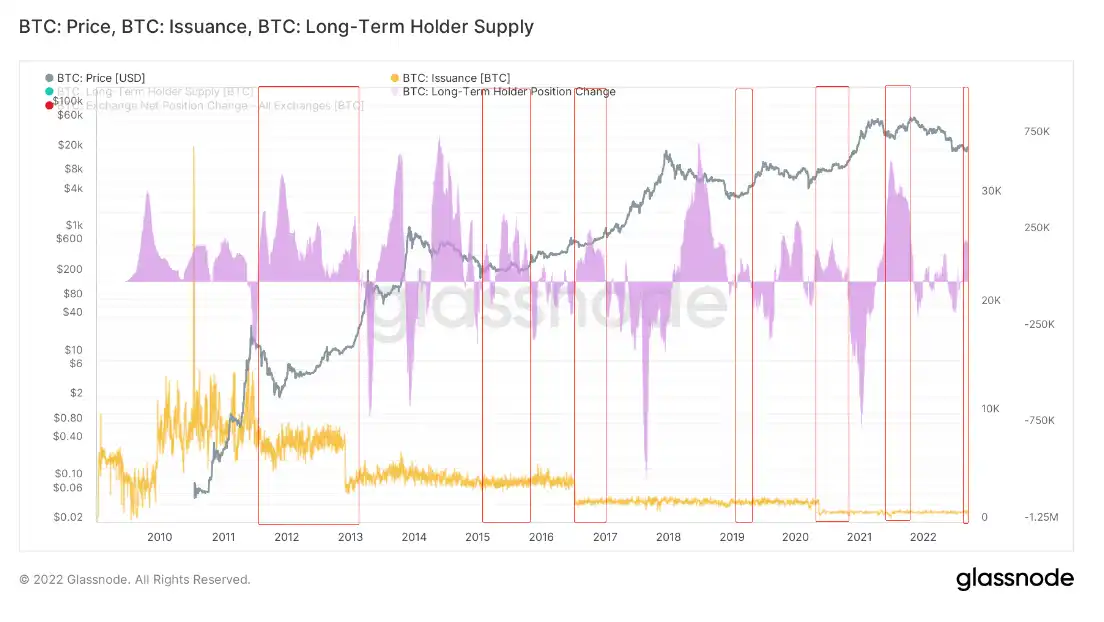
The red area is the long-term investor holding area
Most of the time, the bottom Long-term investors in the region showed an overweight position.
And sell chips at a relatively high level.
In the process of market operation, long-term investors play a decisive role.
At present, long-term investors have changed to the stage of increasing their holdings.
From a long-term perspective, the current market has undergone a certain degree of structural shift.
Mid-term exploration
MVRV4-year rolling score
Network sentiment positivity
Accumulated trend score for each group
Holding supply of high-quality addresses
The sum of holdings and supply of small players
Stablecoin trend net position
Stablecoin trading platform balance
;BTC new force
ETH new force
BTC trading platform trend net position
Long-term traders have not moved supply
Short-term traders untouched supply
Illiquid supply and accumulated addresses
Miners untouched supply
The net position of the giant whale trading platform above 1kBTC
On-chain status rating: undervalued area, trading sentiment is rising
(The picture below MVRV4 year rolling rating)

(Picture below Positive network sentiment)
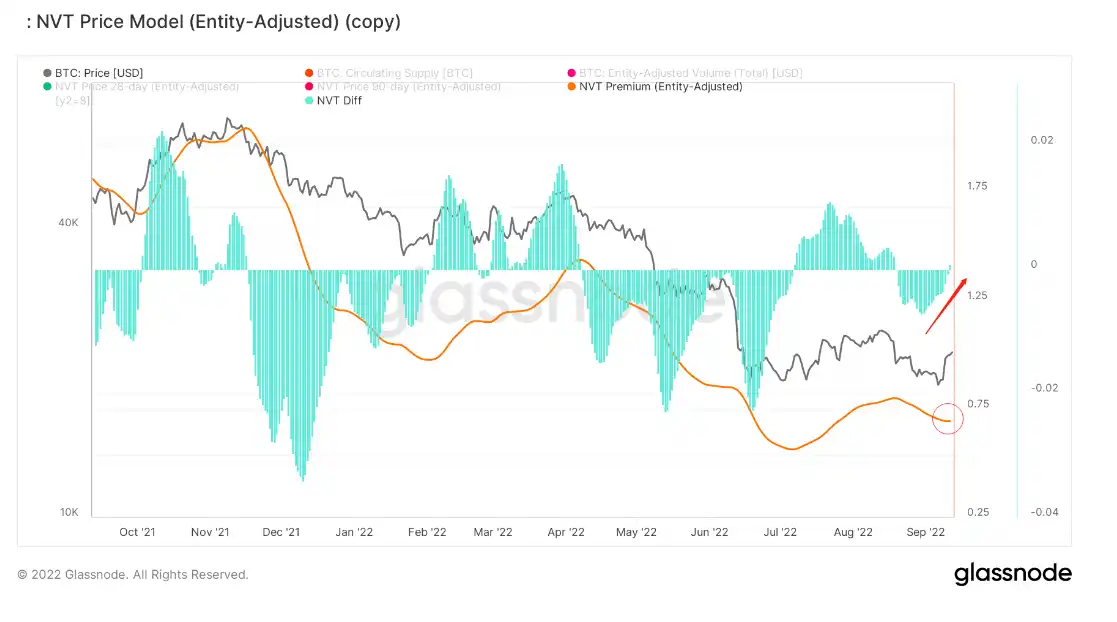
The enthusiasm of the network sentiment has exceeded 0, showing positive growth, which may be due to the rise of trading sentiment.
Rating of each group structure: 10-100BTC and 100-1kBTC large addresses have increased holdings, while small addresses are still increasing
(The chart below Accumulated trend points for each group)

10-100BTC addresses currently have a good accumulation trend score, reaching around 0.6.
The addresses of 100-1k have undergone a sharp accumulation change recently, and the accumulation trend score has rapidly increased to around 0.4.
Small players below 1BTC still maintain a good accumulation situation.
In-depth subdivision of high-quality addresses above 1BTC, and observe detailed changes in a visualized form.
(the picture below holding supply of high-quality addresses)
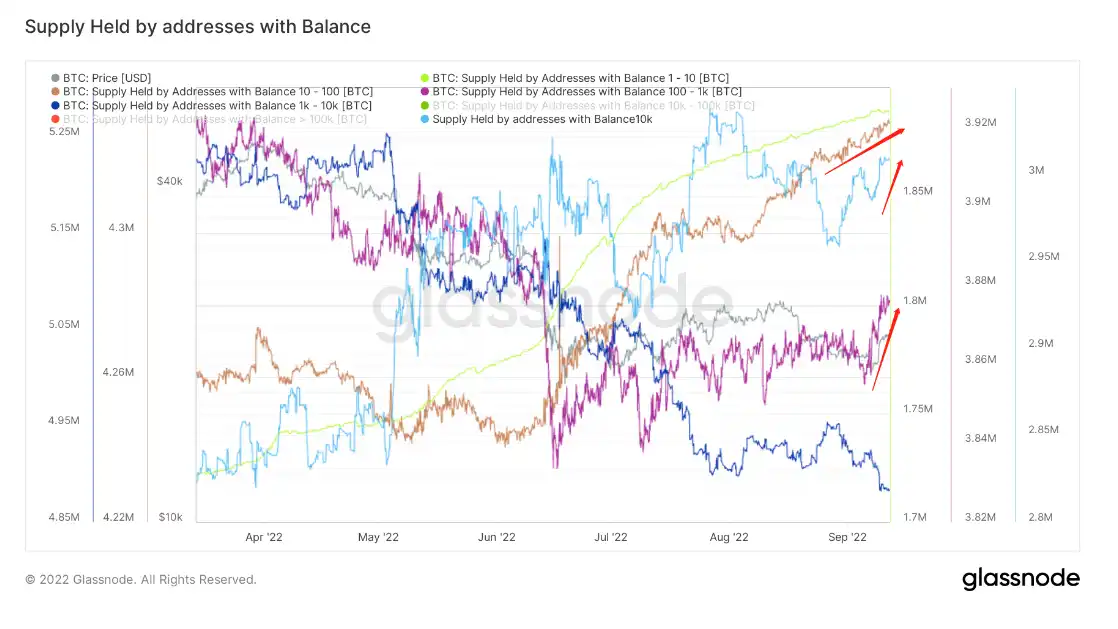
Orange: 10-100BTC address holding supply
Purple: 100-1kBTC address holding supply
< p>The holding supply of 10-100BTC addresses continues to increase.
The address of 100-1k has a relatively large increase in the recent bottom position, and it is currently slowing down.
Because the 100-1k address group has a large amount of currency holdings, it can be judged as a big investor attracting funds or increasing their holdings.
10-100BTC increases holdings more chips.
The two may become groups that have a greater impact on the market in the near future, and they need to be paid attention to.
Let’s look at the overall situation of small players.
(The picture below the sum of the holdings and supply of small players)

Recently, small-scale players have resumed their attitude of accelerating their holdings, and their net positions show an increase in holdings.
Buyer’s Rating: The inflow is slowing down, and the current partial stock
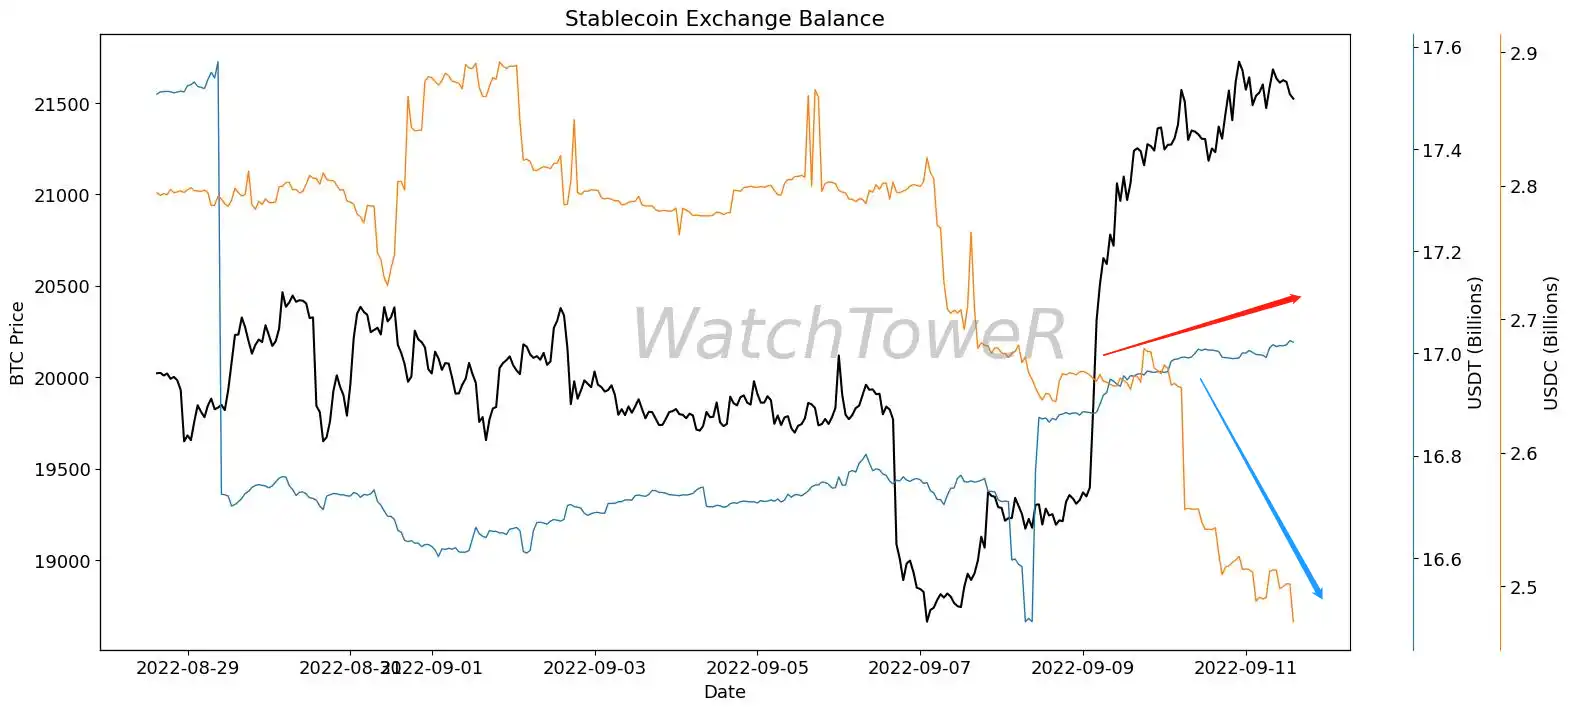
(the picture below stable currency Trend net position)

There is a certain amount of inflow of USDT, which may be in the near future subject of purchasing power.
USDC is still flowing out, wait and see.
Combined with the balance of the stablecoin trading platform, observe more carefully.
(Pictured below balance of stablecoin trading platform)
Overall:
After USDT has a high inflow, it shows a slowing down trend.
USDC is still slowly flowing out.
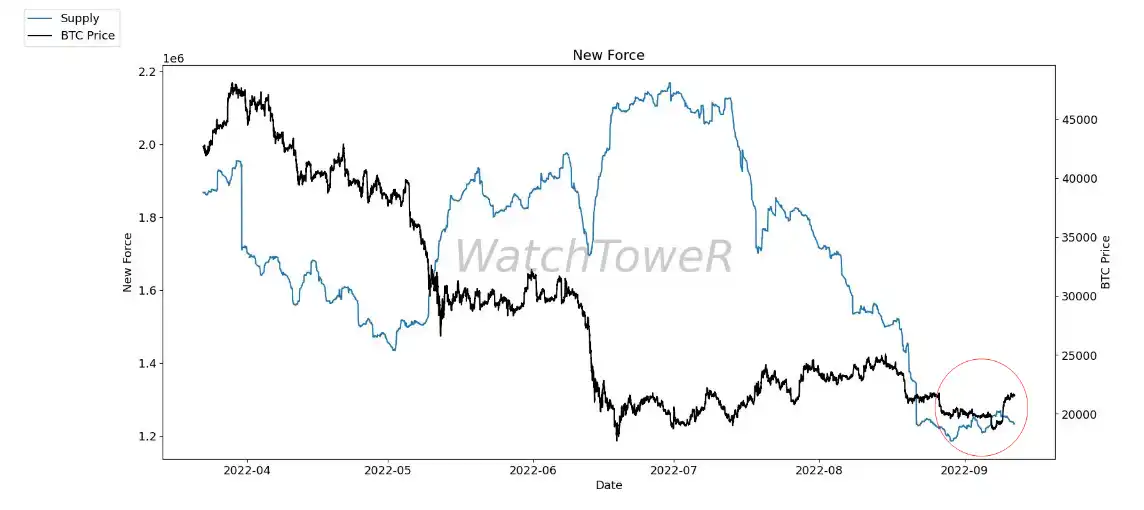
Observe the status of the new force and look for new buyers in the market.
(pictured below BTC new force)
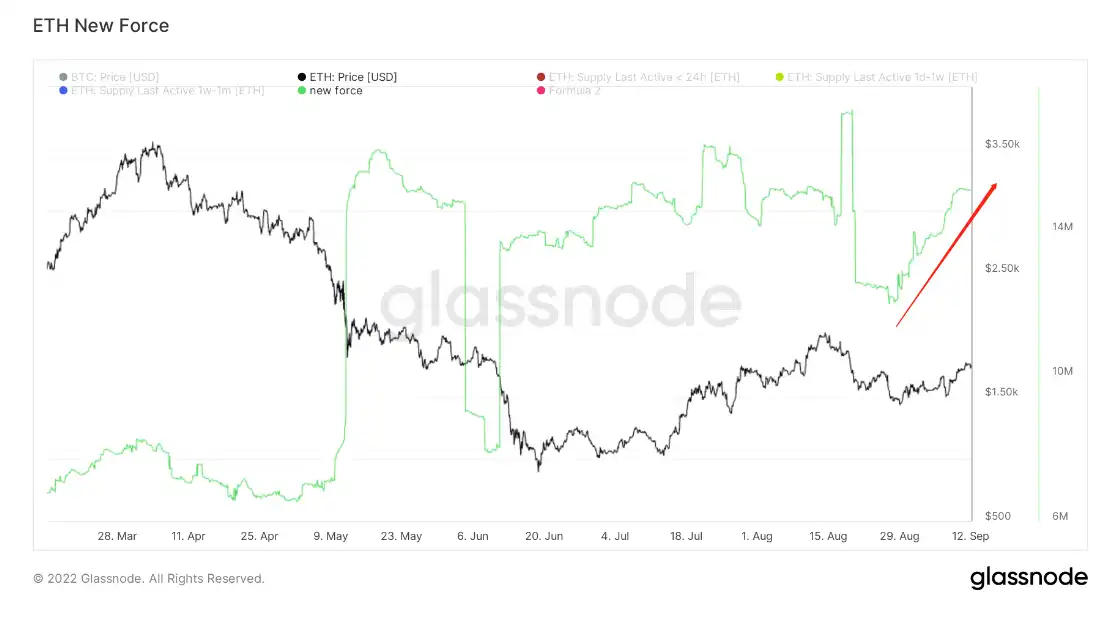
(The picture below ETH new force)
The new force of BTC has a certain amount of acceptance, and the trend is not obvious.
The growth of ETH's new force has slowed down slightly.
Combined with the status of stablecoins, the recent stock purchasing power usage is good, and the new force of ETH continues to increase its holdings, which is currently slightly slowing down.
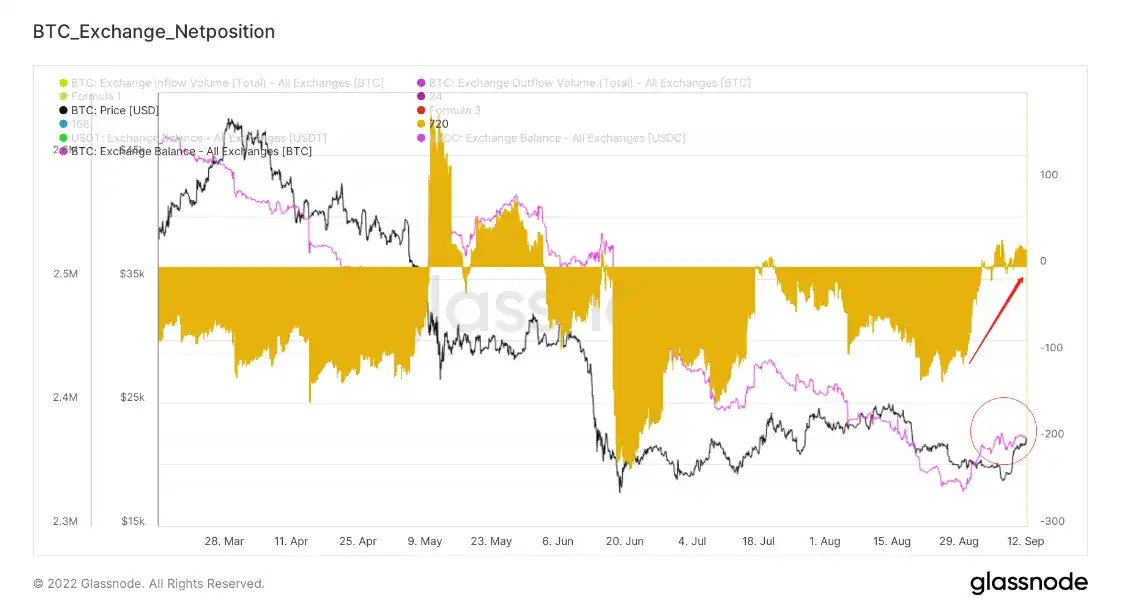
Rating of selling pressure: Potential selling pressure is still accumulating, but the current amount of BTC available for sale is being compressed
< /p>
(below BTC trading platform trend net position)
< /p>
From the trend net position of the BTC trading platform, there is still potential selling pressure accumulated on the trading platform.
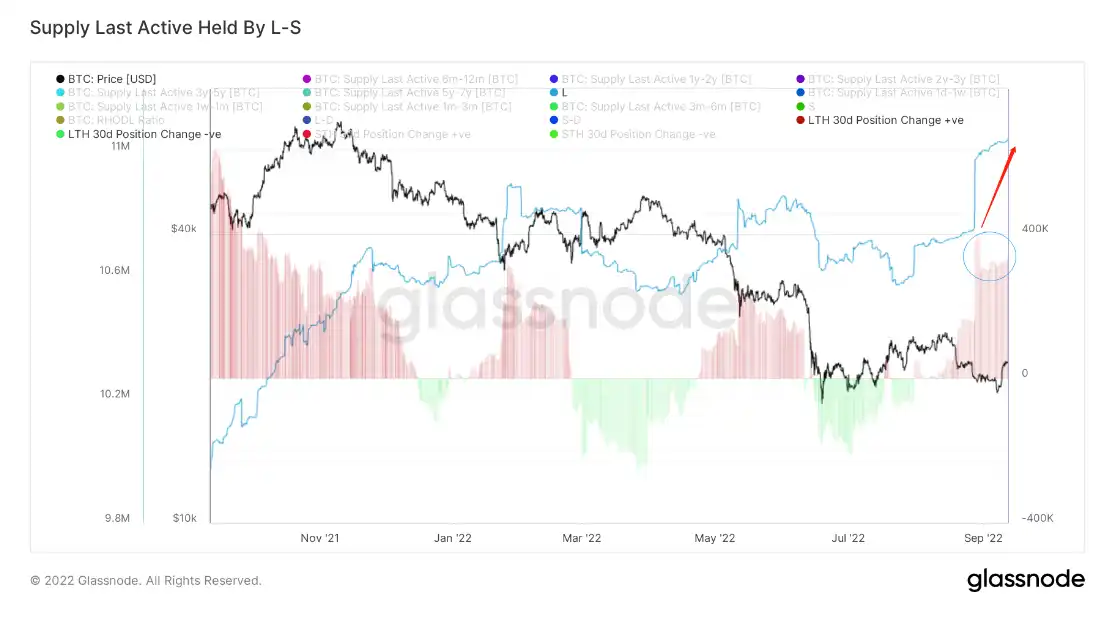
(Picture below Long-term traders have not moved supply)
 < /p>
< /p>
Long-term traders are still accumulating chips in the near term, but growth has slowed slightly.
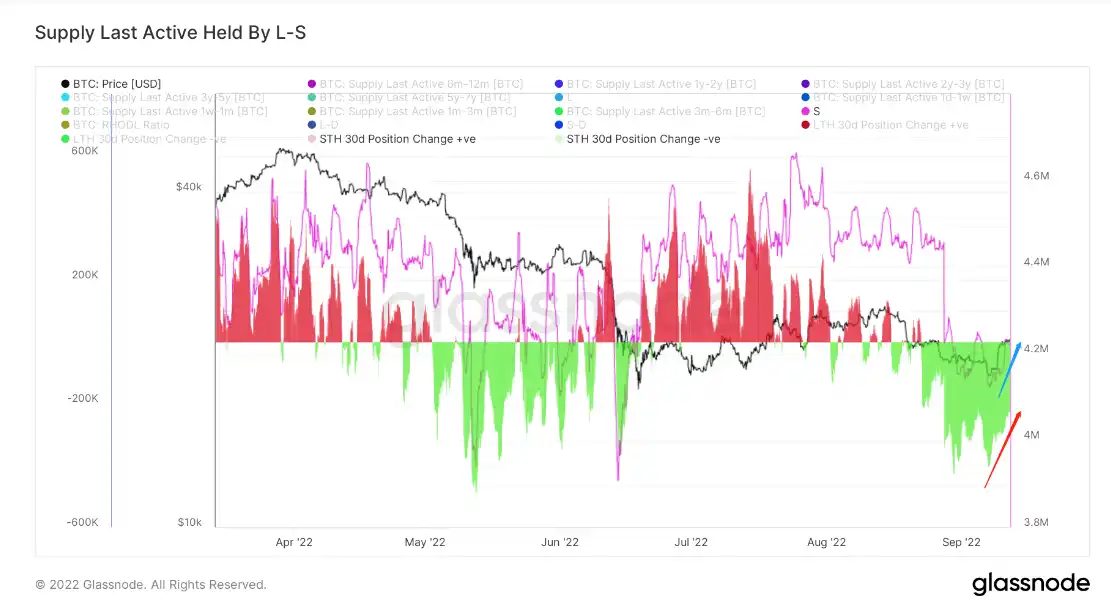
(The picture below Short-term traders have not moved supply)
 < /p>
< /p>
Short-term traders have re-accumulated after recently reducing their holdings, and are currently slightly slowing down.
The main group who sold in the recent market is short-term traders.
(Figure below Number of illiquid supply and accumulation addresses)
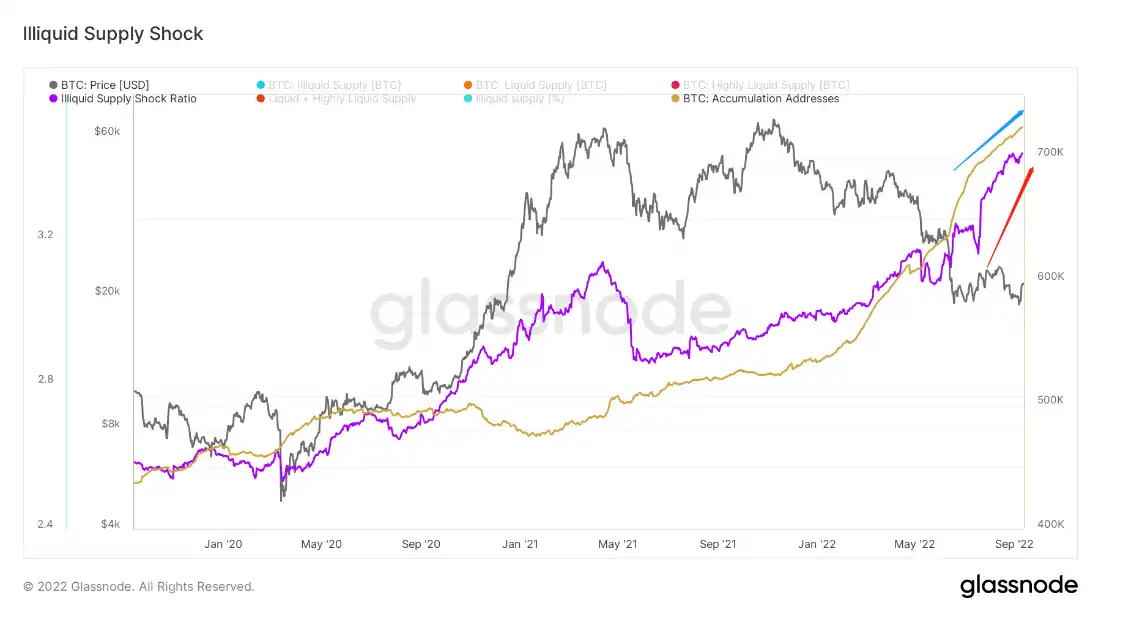
Purple: The proportion of illiquid supply
Yellow: The number of accumulated addresses
Accumulated address count counts more than 2 purchases and addresses that have not moved.
The number of accumulated addresses has increased a lot in the past six months, which may mean that more and more addresses in the market are willing to hold.
The proportion of illiquid supply has now increased to 77.4%, and the BTC available for circulation in the venue has been compressed. Further deduction, it can be known that the BTC that sellers can sell will be will be more limited.
Combined with the trend net position of the trading platform, in-depth insight.
The recent accumulation behavior of illiquid groups is contrary to the accumulation of potential selling pressure on trading platforms, and there are differences. The current structure of the game is more intense and may continue to increase The probability of market volatility.
But from a mid-to-long term perspective, or even a longer perspective.
The amount of BTC available for sale is getting smaller and smaller, which may cause the decline caused by the seller to shrink under the deflationary effect.
Important group rating: miners slightly increase holdings, giant whales slightly accumulate potential selling pressure
( The picture below miner unmoved supply net position)

miner Recently, the sell-off has slowed down and turned into a slight increase in holdings.
(Picture below 1kBTC or more giant whale trading platform net position)
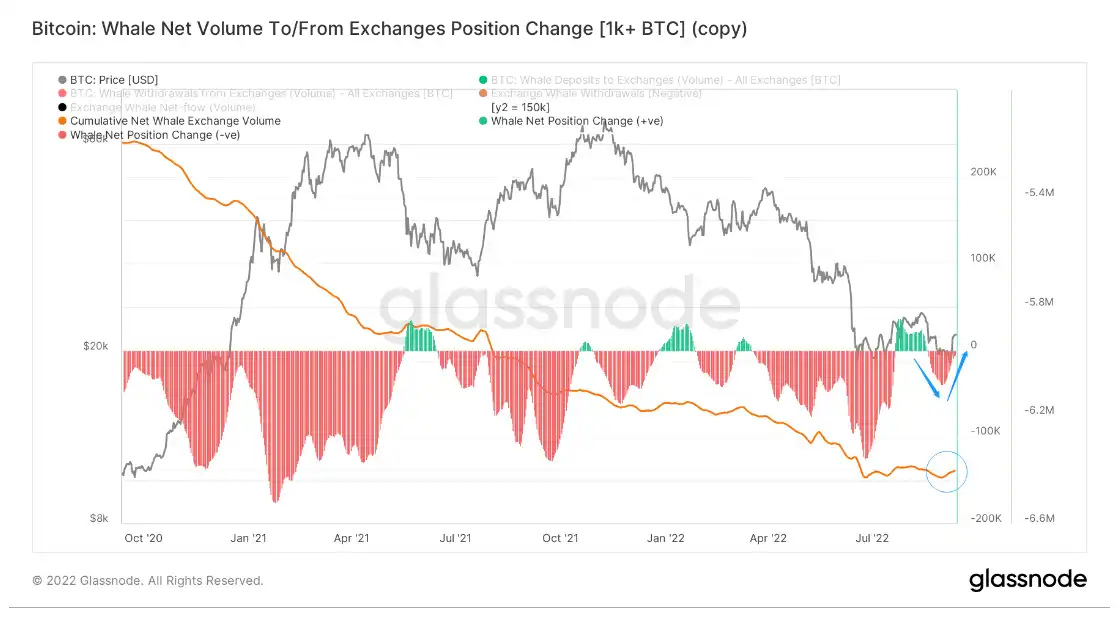
There are signs of slight inflow of giant whales above 1k, and the potential selling pressure of giant whales has increased slightly.
Short-term observation
Long liquidation advantage
Futures Rate of change in open interest
funding rate, average cost
coin standard, U standard contract
put/call Option position ratio
7-day chip change chart
Short-term holders in a loss state
Profit and loss transfer volume
BTC trading platform net position
Global time zone purchasing power
Derivatives Rating: Rising Risk
(Pictured below long liquidation advantage)

Green: Long liquidation advantage
Blue: Short liquidation volume
Recently, a large number of short positions have been liquidated in the market. The liquidation advantage has declined to a large extent, with a low of close to 46.2%. This value shows the initial effect of liquidation short leverage in the market.
At present, the value has risen to around 47.5%, and the risk of derivatives should be paid attention to at the moment.
(The figure below the rate of change in futures open interest)
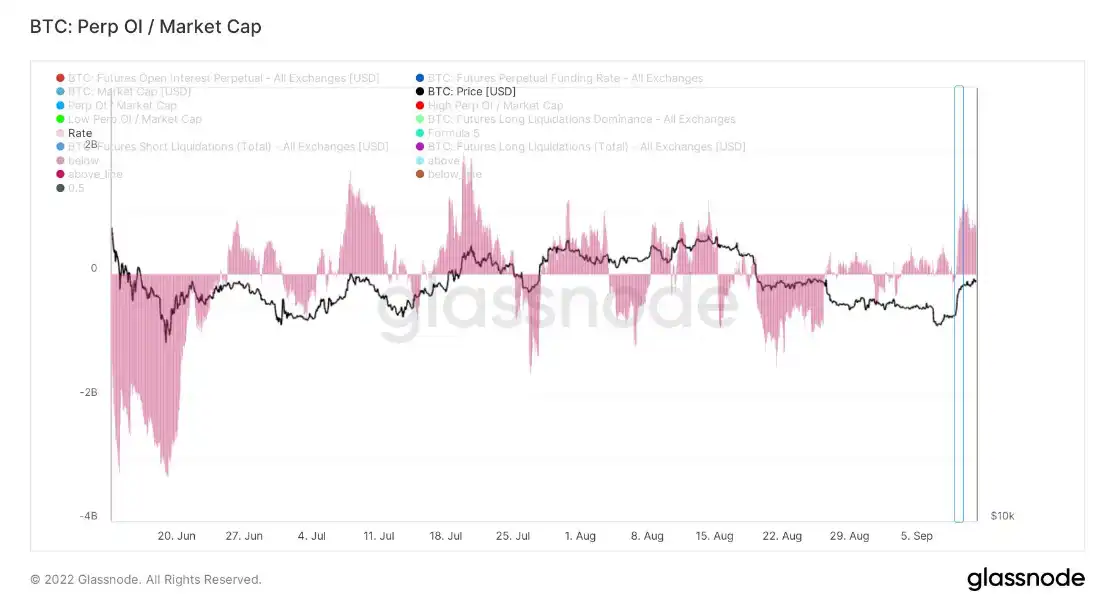
When the market has recently risen to a high level, the change rate of derivatives has risen rapidly in the short term, which means that the leverage risk has risen rapidly, and the impact of derivatives on the market is slightly weighted aggravated.
(The following picture funding rate, average cost)
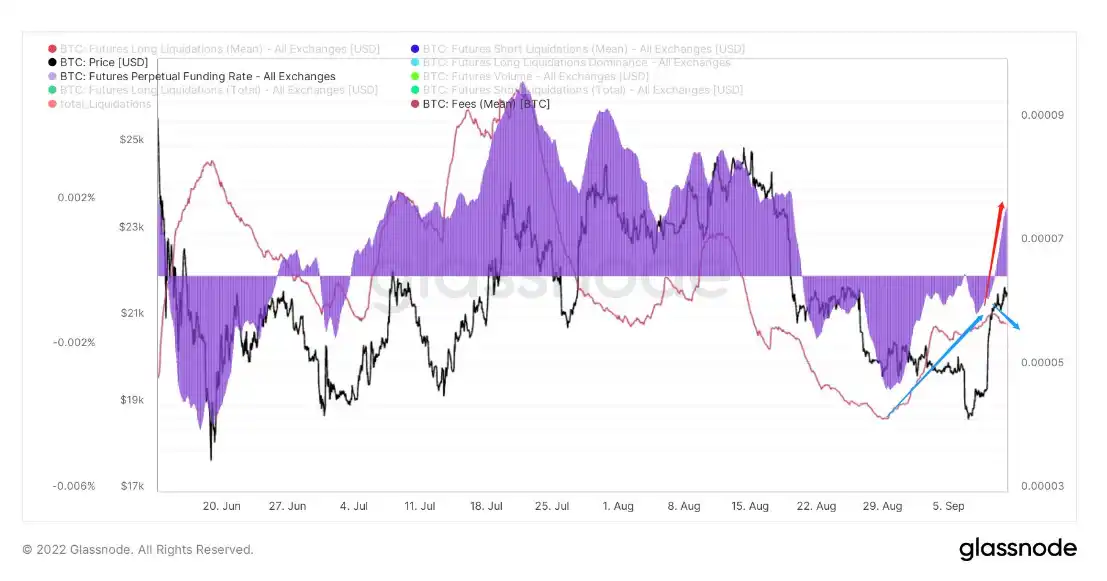
Blue: Funding Rate
Red: Average Cost
Comprehensive average cost, the indicator shows signs of falling after rising, which means that the activity on the chain has slowed down slightly recently, which is worth noting in the short term.
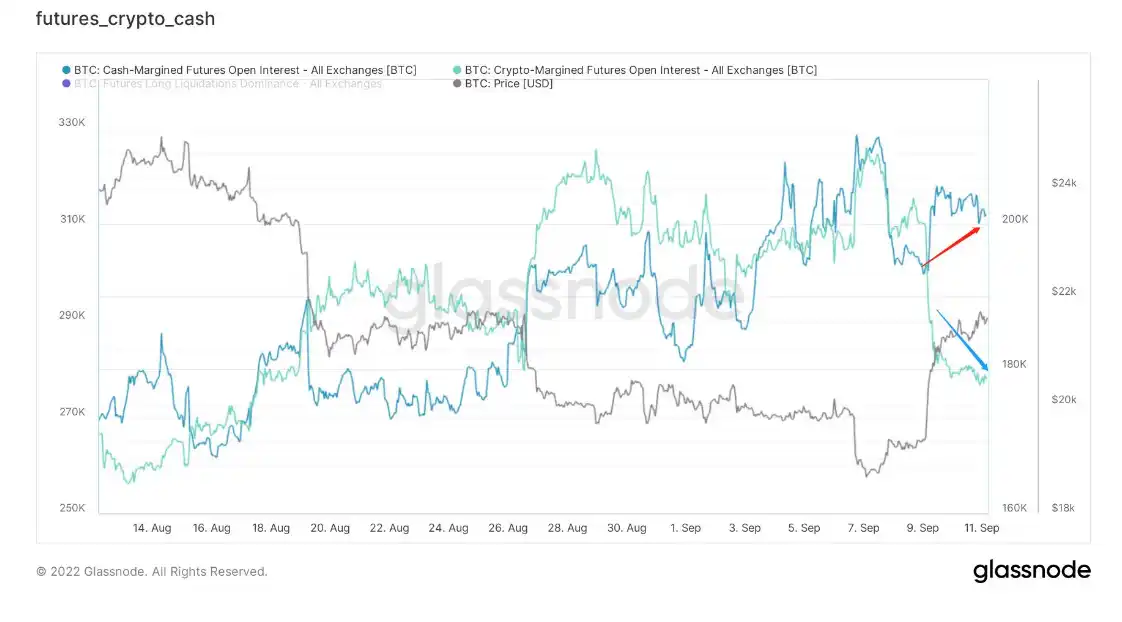
(Pictured below coin standard, U standard contract)
 < /p>
< /p>
Dark blue: U standard contract
Light green: currency standard contract
Interestingly, the currency-based contract is inversely proportional to the market price, which means that traders who think of currency-based contracts tend to wait and see in the current market.
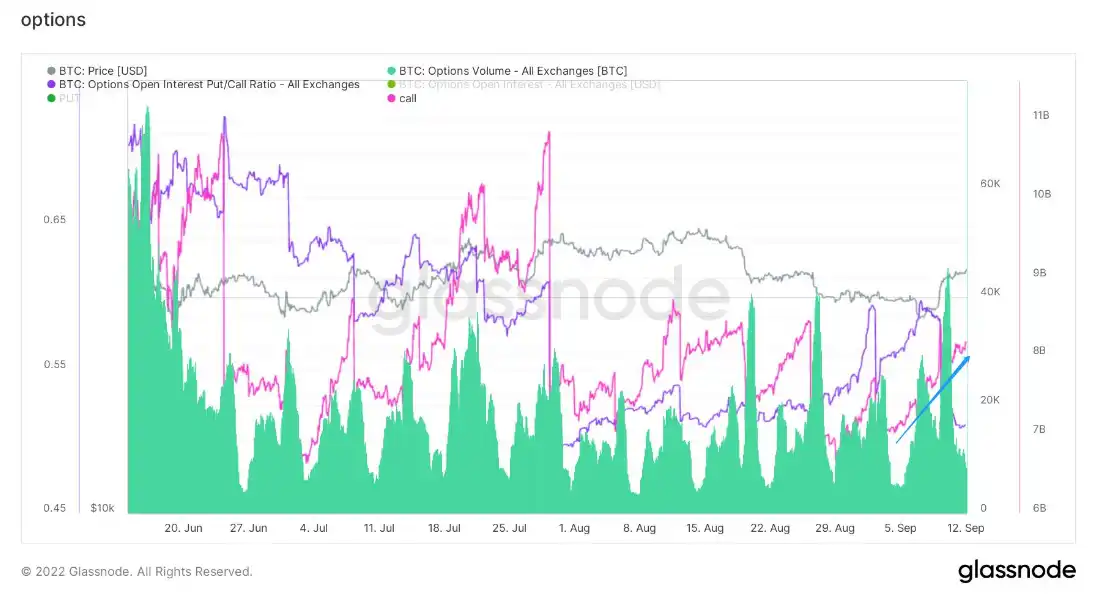
(Put/Call option position ratio in the picture below)
 < /p>
< /p>
Red: call option open interest
Purple: put/call option open interest ratio
In the option market, a large number of call options rise in the short term, while put options fall.
Mature groups’ bets on the future market have undergone certain changes compared to the previous large amount of bearish protection.
Spot market
Rating of chip structure: Undertaking rising, stock game
(The chart below 7-day chip change chart)
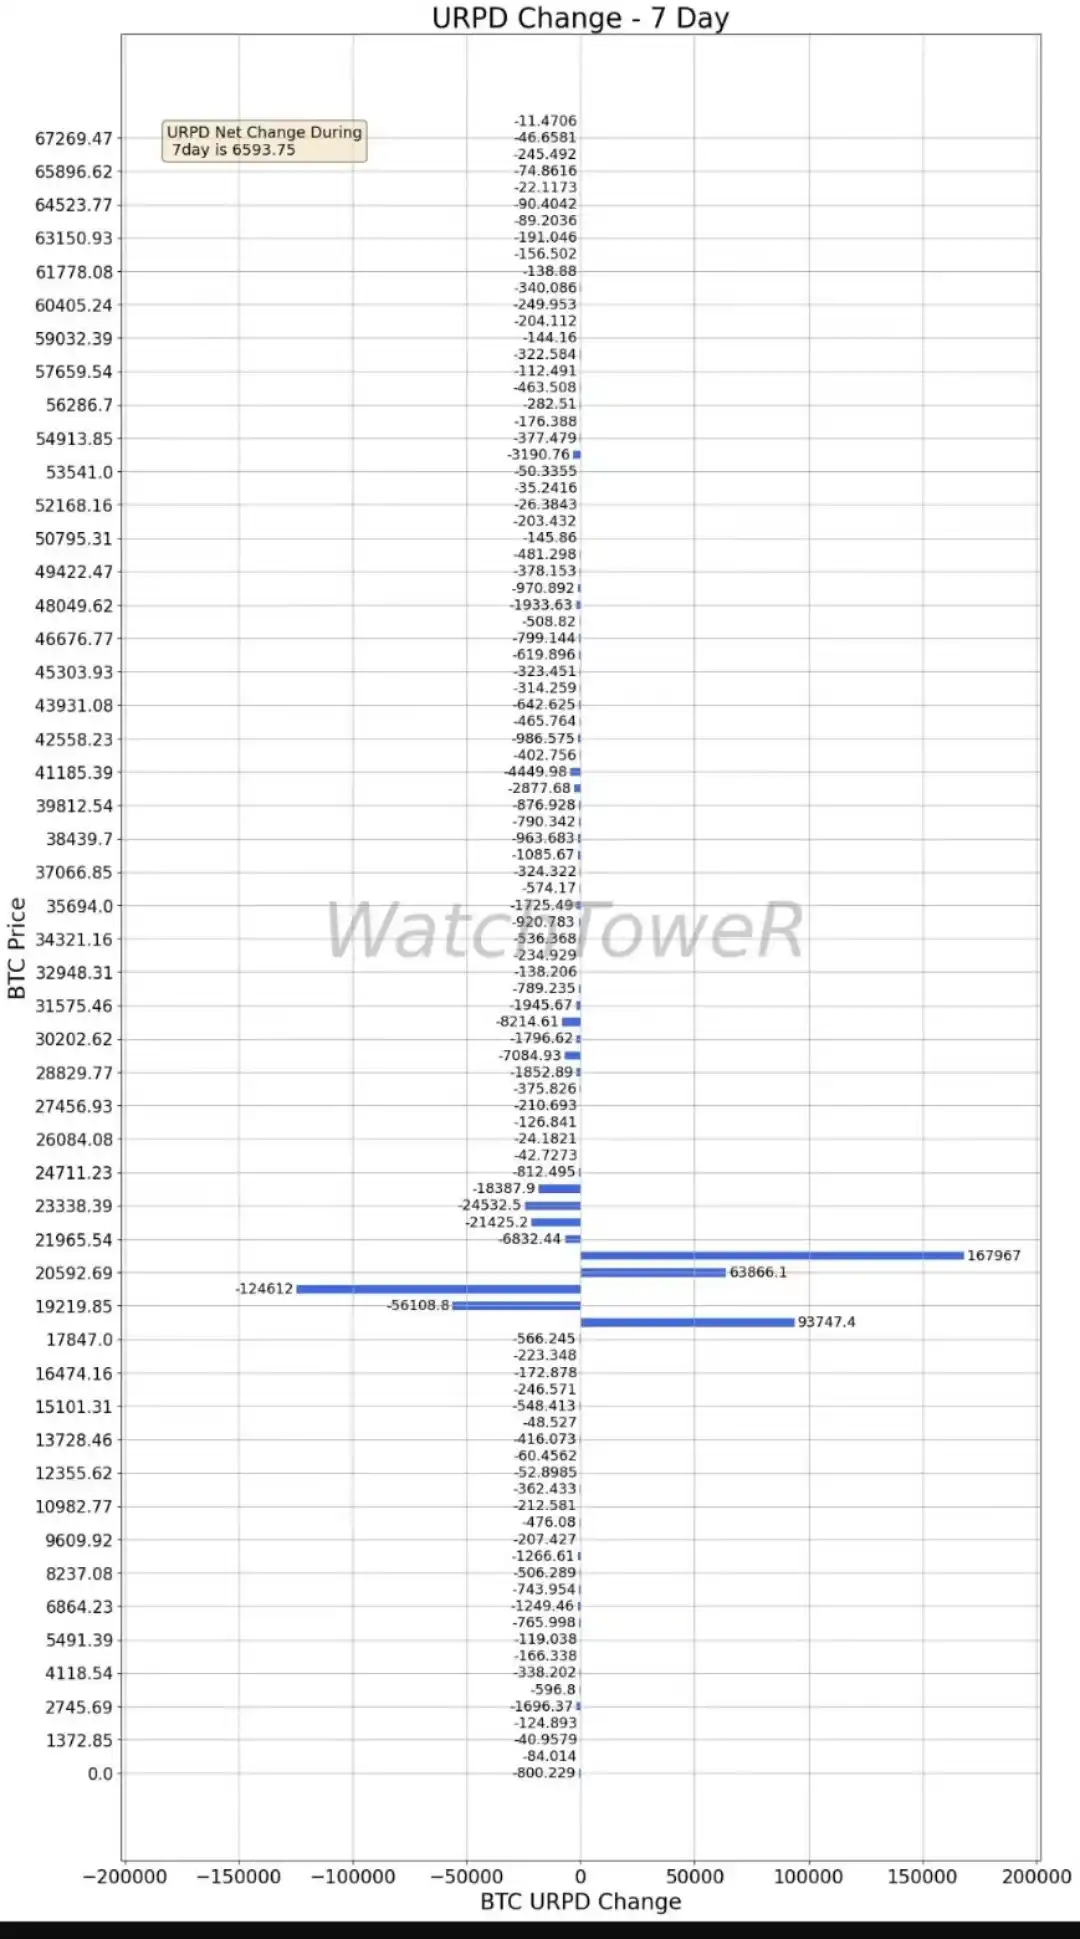
The net increase of the 7-day chip change is about 6593 BTC.
About 70,000 chips were sold at a loss between 21900 and 24000,
about 230,000 chips were added around 21200~22000,
19200~19900 Nearly 70,000 chips were sold for profit, and 18,500 took over about 93,000 chips.
The game of chips in the market is more intense, the upper loss chips continue to be removed, and the remaining stock chips are between 18,500 and 212,00, which is an important short-term position.
(Short-term holders in the picture below in a state of loss)
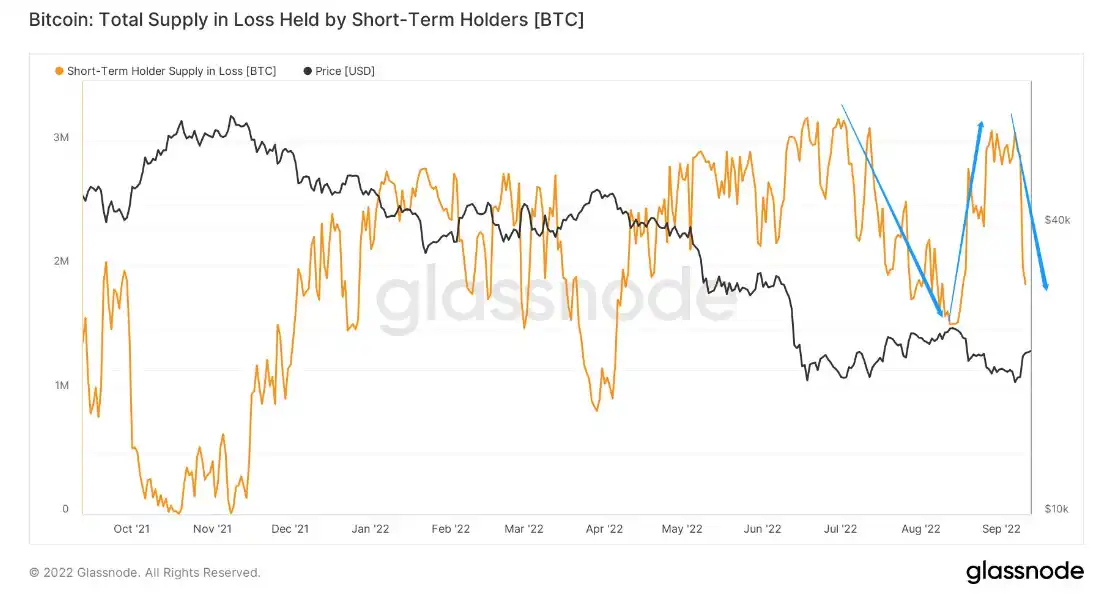
Short-term holders are in a state of loss, and in the short-term it rose from close to 18,500 to 21,200, during which nearly 1.2 million chips changed from a state of loss to a state of profit.
This means that short-term holders have a strong willingness to undertake in this price range, and it also shows that most of the current stock chips are short-term holdings Holders, so there is still a lot of uncertainty in the fluctuations.
It is necessary to pay attention to the psychological price range, and then the psychological game of the market.
Market Status Rating: Profit Selling
( profit and loss transfer volume in the picture below)< /p>

The market is going up in the short term, and the market is in a clear profit selling mood. At the current stage Profit pressure is initially near local highs.
Next, we need to pay attention to whether the sentiment of selling at a loss will change.
(BTC trading platform net position in the picture below)
< img src="https://image.blockbeats.cn/upload/2022-09-14/ce73d60388c71b3d4f982b9e3c6443fbfafbb10f.png?x-oss-process=image/quality,q_50/format,webp" alt="Night mist light cage, Long Zhe Siqi | WTR 9.12" width="1800" height="1013">
The balance of the trading platform has risen and then hovered, and the comprehensive BTC trading platform has a net inflow Amplitude contraction.
There are two possibilities for this chip:
1. The chips are sold by profit, and the chips are still in the trading platform.
2. There is still potential selling pressure.
Purchasing power rating: restoration, low
(Purchasing power in the global time zone below)< /p>
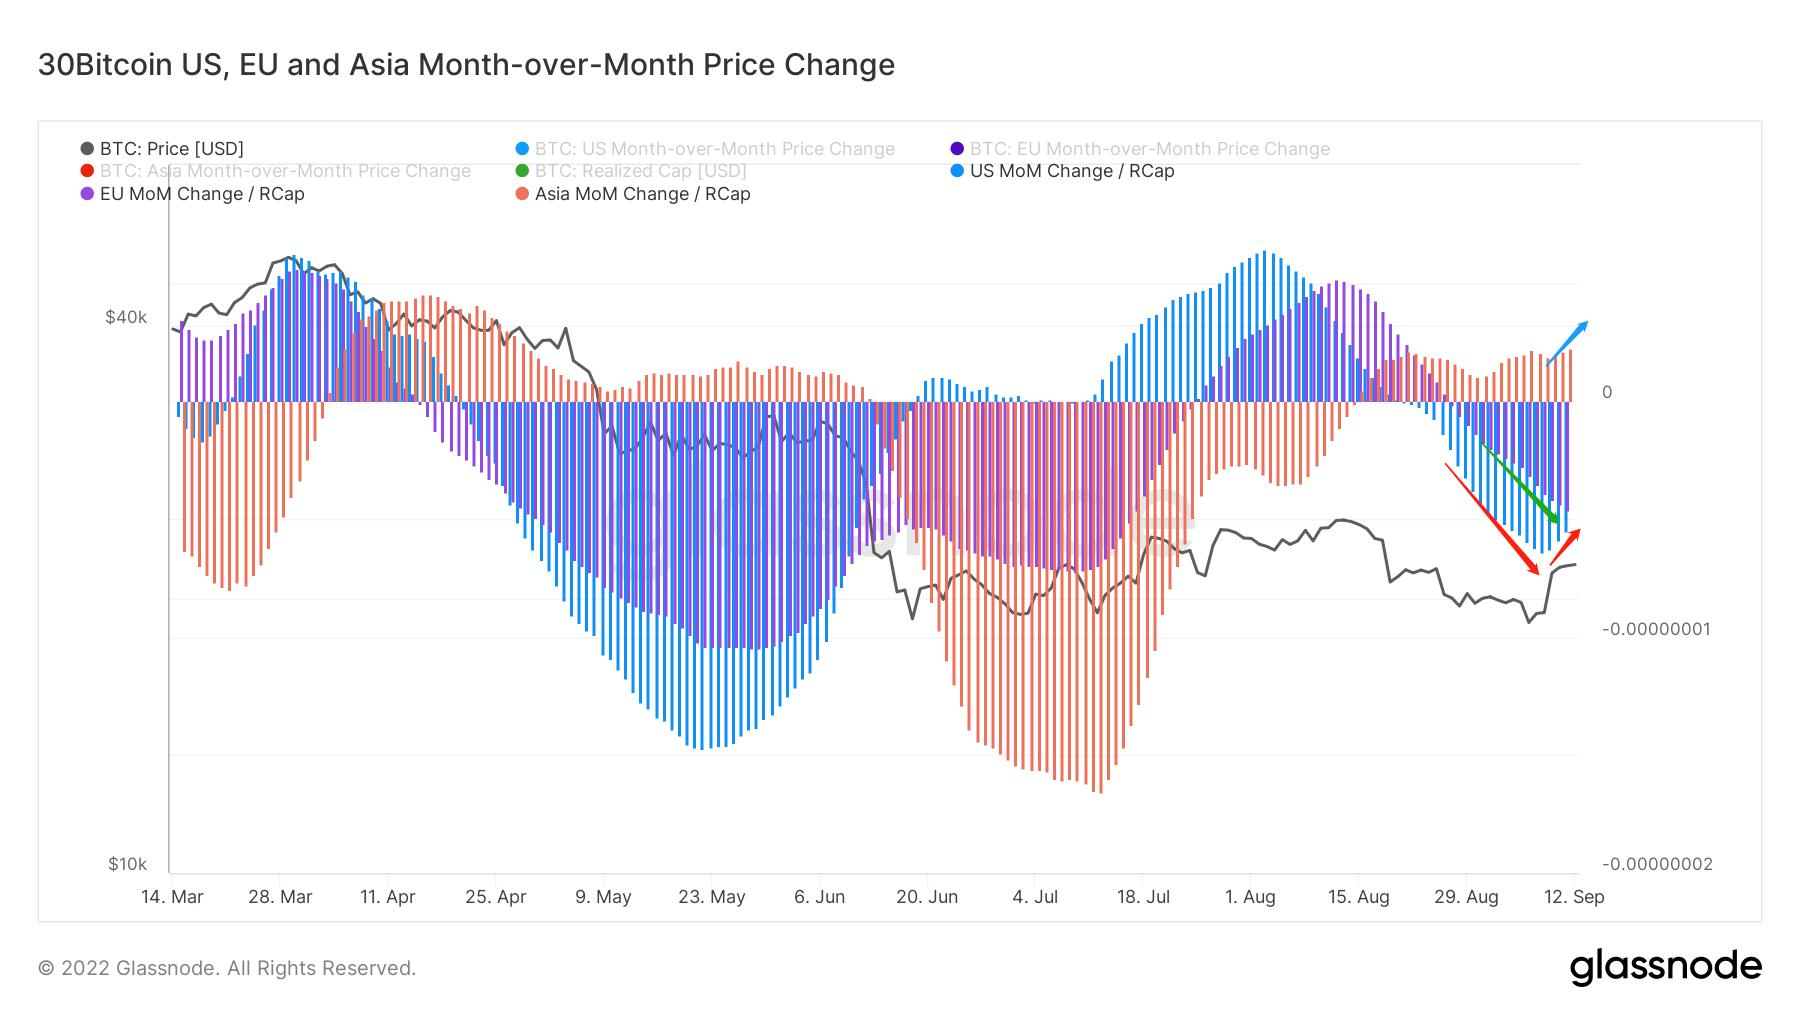
The decline in purchasing power in the American time zone has slowed down,
The purchasing power in the European time zone is still declining,
There are signs of a slight increase in the purchasing power in the Asian time zone, which is still the main force in the current market Take power.
There are signs of recovery in purchasing power, so we need to continue to pay attention.
Off-chain data rating: disagreement
(below Binance trading platform order book)
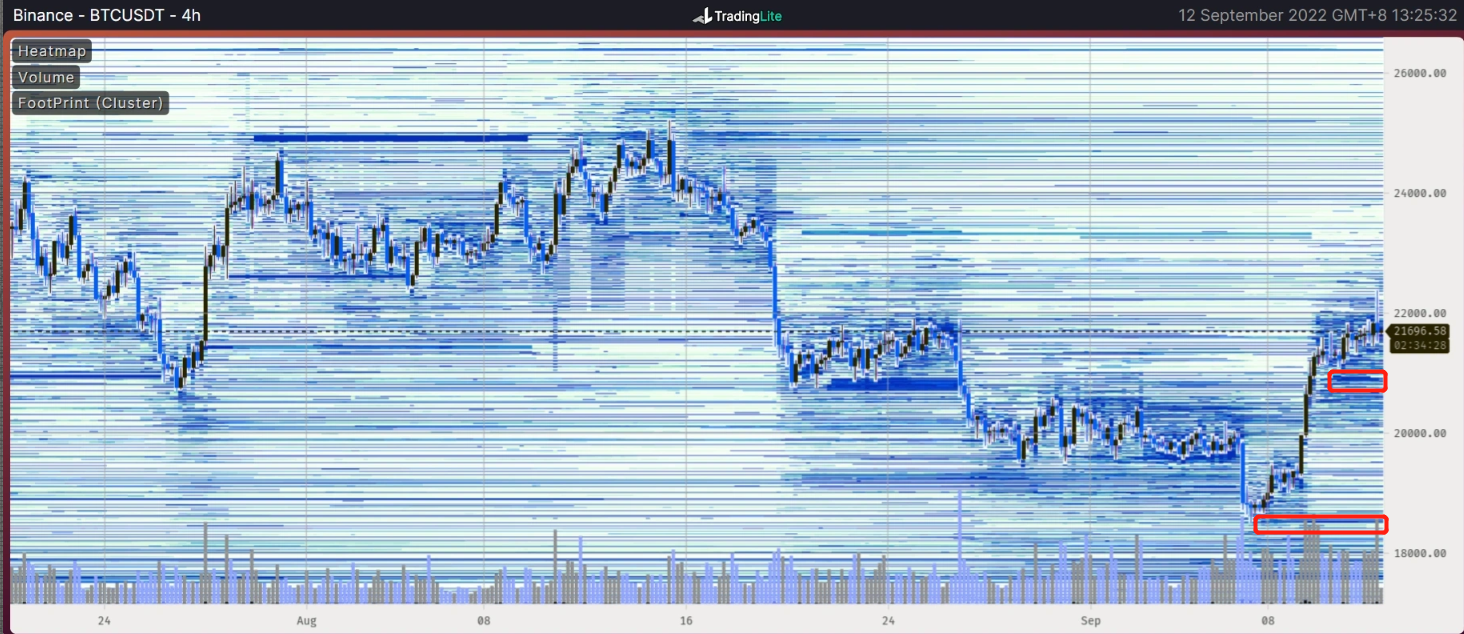
< br>
Binance has a touch of buyer pending orders around $20,900 and $18,500.
(Bitfinex trading platform order book below)
< img src="https://image.blockbeats.cn/upload/2022-09-14/60416a5d7f27d71b67425d64af5863370464cb6a.png?x-oss-process=image/quality,q_50/format,webp" alt="Night fog light cage, Long-term Thinking | WTR 9.12" width="1462" height="630">
Binance has a buyer's pending order around $18,500.
(Coinbase trading platform order book in the picture below)
< img src="https://image.blockbeats.cn/upload/2022-09-14/95feeffde5a6724ea9524ea3a846cc6d8c7f40b6.png?x-oss-process=image/quality,q_50/format,webp" alt="Night fog light cage, Long-term Thinking | WTR 9.12" width="1462" height="639">
Coinbase has more pending orders from buyers below $18,000.
This week's summary:

Message summary:
1. The UK's inflation rate has reached a 40-year high, the UK's ranking among the world's largest economies is slipping, and the pound exchange rate is at its lowest level since the mid-1980s
2. Investment Investors expressed concern about Britain's increasingly bleak economic outlook, with the yield curve showing that markets are pricing in a recession.
3. The exchange rate of the US dollar against other major currencies is 20% higher than its long-term trend level, and the fundamental imbalance is not good for the US dollar.
4. If the ratio of the current account deficit to GDP is consistently higher than 5%, it is a reliable signal that a financial crisis is coming. The U.S. current account deficit is now approaching the 5% threshold, which could signal a mild recession.
a. The U.S. currently owes the world a net $18 trillion, or 73% of U.S. GDP, well above the 50% threshold that typically heralds a currency crisis in the past.
b. The dollar's share of foreign exchange reserves was 59%, the lowest level since 1995. Digital currencies may look battered now, but remain a long-term alternative.
5. Of course, there is no complete standard that can replace the US dollar, and the relative advantage still exists.
6. The purpose of BTC crossing the bull-bear is to persist until the stop of interest rate hikes. The period of interest rate rise is more difficult. After the interest rate stops rising, the market may cause BTC to stop falling due to negative factors.
Long-term insights on the chain:
1. At this stage, the potential increase in trading platforms In the strength stage, the overall potential strength is similar to that in the first half of 2020.
2. High-quality selling pressure has dropped to a three-year low.
3. Long-term investors have changed their attitudes and relatively increased their holdings.
4. In the long run, the market is quietly undergoing a structural shift.
Market setting:
Market A shift is taking place, and the period ahead will be critical.
The market is currently undergoing structural changes.
Mid-term exploration on the chain:
1. The market value is underestimated within 4 years Area, still repairing valuation;
2. The enthusiasm of online sentiment broke through 0, and the trading sentiment rose;
3. Large players increased their holdings, while small players increased their holdings
4. Purchasing power is biased towards stock, USDC outflow is more, USDT inflow slows down;
5. BTC new force has a certain degree of acceptance, ETH newborn The strength growth is good, and both are currently slowing down;
6. A certain amount of potential selling pressure has accumulated within the trading platform, and the main body of recent selling is short-term traders;
7. Both long-term traders and illiquid supply groups have increased their holdings. At the same time, the number of accumulated addresses has increased, which may further reduce the number of sellers on the market;
8. The reduction of miners' holdings has slowed down and increased slightly Hold; giant whales have a small amount of potential selling pressure on the trading platform.
The market sets the tone:
undercurrent Surging, cautious
Buyers tend to accumulate and cautious attitudes, and the market tends to be a stock game. There is still potential selling pressure inside the trading platform, and the current market needs to be handled carefully.
Short-term observation on the chain:
1. Product risk has risen slightly.
2. The open interest of call options has increased slightly recently.
3. The net increase of chip changes on the 7th was about 6593 BTC.
4. Profit selling is under pressure close to local highs.
5. The potential selling pressure is still high.
6. Purchasing power has been slightly restored, and the overall level is low.
7. The off-chain data is inconsistent.
8. The probability of not falling below 16000~18500 is 62%.
Market setting:
Derivative The risk of commodities has risen slightly, and traders of derivatives options and futures have disagreements. It is necessary to pay attention to whether the market will remain strong after the impact of profits.
Risk Warning:
The above are all market discussions and explorations. Investment does not have directional opinions; please be cautious and prevent market black swan risks.
This article is from a contribution and does not represent the views of BlockBeats.
Welcome to join the official BlockBeats community:
Telegram Subscription Group: https://t.me/theblockbeats
Telegram Discussion Group: https://t.me/BlockBeats_App
Official Twitter Account: https://twitter.com/BlockBeatsAsia